Discover more about S&P Global’s offerings
— Almost 60% of companies in the S&P 500® (market capitalization of $18.0 trillion) and more than 40% of companies in the S&P Global 1200 (market capitalization $27.3 trillion) hold assets at high risk of physical climate change impacts. Wildfires, water stress, heatwaves and hurricane (or typhoons) linked to increasing global average temperatures represent the greatest drivers of physical risk.
— Regulatory transition risks, as represented by carbon pricing risk, is greatest in the Australia and US market benchmarks, linked in part to the high degree of action needed to shift comparatively weak carbon pricing policies to deliver on climate change goals.
— Companies are exposed to a patchwork of climate change regulations such as carbon taxes, emissions trading schemes and other fossil fuel taxes. Company exposure and resilience to both transition and physical risks does not conform to clear sectoral patterns, highlighting the need for in-depth analysis to evaluate climate risk at the asset and company level.
— Companies and investors should seek to better understand their exposure to climate risks and offer greater disclosure and transparency on climate-related risks, in line with the guidelines of the Taskforce on Climate-related Financial Disclosures (TCFD).
— For a PDF of this report, please download.
The future financial and social consequences of climate change are becoming increasingly apparent to companies, investors and policy makers. Strong action to reduce emissions and limit climate change may avoid the worst physical impacts of climate change but presents significant market, technology and regulatory transition risks for market participants. Conversely, failure to adequately reduce greenhouse gas emissions may limit transition risks but will result in increasing climate change and associated physical risks.
This paper explores the interplay between regulatory transitional risks and physical risks under alternative climate change scenarios, and how this may impact the performance of companies across sectors and geographies.
Recent and intensifying natural disasters, such as the 2018 California wildfires and 2017 Hurricanes Harvey and Maria, are emblematic of a climate changed world and increase our understanding of the future social and economic consequences of climate change. Research by the European Central Bank found that weather-related catastrophic losses accounted for 80% of all insured losses in 2018.1
The physical risks caused by past and future inaction on climate change are contrasted with the potential risks and opportunities of ambitious action to limit climate change, as highlighted in the 2017 guidelines of the Financial Stability Board’s Taskforce on Climate-Related Financial Disclosures (TCFD). Given the uncertainty around how the world will respond to the climate change challenge, it is critical that companies and investors understand how business models, supply chains and markets may change and evolve under future climate change scenarios. Strong action to limit climate change could result in significant technology, regulatory and market transition risks while inaction will result in the exacerbation of climate change along with the physical risks to assets, operations and supply chains.
This paper explores the interplay between regulatory transitional risks and physical risks under alternative climate change scenarios, and how this may impact the performance of companies across sectors and geographies. This analysis combines two climate analytics developed by Trucost, part of S&P Global:
In combination, these analytics power climate-related scenario analysis, in an effort to yield insight into the potential resilience of corporate business models and investment strategies that may be affected by future climate change.
Contributed by DWS Group — Murray Birt, Senior ESG Strategist
The investor case for action on climate change can be seen economically and financially. For investors, what matters is whether these risks and opportunities are reflected in equity and bond valuations. So-called valuation mirages occur often in finance and there is historical evidence that capital markets often fail to recognize risks.1 For example, equity analysts covering a major manufacturing company did not adjust their forecasts until after a fraud was announced, despite warning signals being available. Analysts covering a US coal company believed that profitability would recover, just before it went bankrupt.3
It may be possible to analyse correlations between physical risk and financial indicators. The results of such an analysis may inform an investment strategies and goals. For example, an active or passive strategy might seek to create improved risk adjusted returns by overweighting leading companies and under-weighting or excluding laggards.1
Divesting or over/underweighting stocks may simply only shift financial risk and does not truly change whether a company improves their resilience, reduces their emissions or improves gender diversity and income equality. Investor influence (engagement/stewardship) can encourage companies and policy-makers to improve policies and practices. Additionally, there is some academic evidence that investor engagement on ESG and climate may help financial performance.2
Companies are also increasingly recognizing climate change physical and transition risks as strategically important. A recent report by CDP (formerly known as the Carbon Disclosure Project) finds that 53% of companies reporting to CDP identify climate-related risks with potential to have a substantial financial or strategic impact on their business.3 Among the world’s largest 500 companies by market capitalization, risks valued at over $970 billion were identified, half of which were reported as likely, very likely or certain, and one quarter were linked to asset impairments or write-offs.3 This was contrasted with optimism on the potential climate-related opportunities valued at over $2.1 trillion.3
Stronger engagement by investors is necessary to encourage companies to reduce their emissions and to change their business models. According to Ceres,4 for the last six years, DWS has had one of the strongest track-record voting in favor of climate-related resolutions. Currently DWS believes that companies will be a large source of private capital for adaptation. Investors can help accelerate corporate capital investment in resilience and ensure social justice is incorporated through their expectations and engagement with companies.
Changes in climate change physical risks, such as droughts, floods and hurricanes, are expected to vary widely across the globe with existing hazards increasing in intensity in some regions and with other regions becoming subject to hazards not previously experienced. For example, scientific studies suggest that tropical cyclone rainfall rates and intensities are likely to increase due to climate change,7 and trends suggest that the locations at which cyclones reach maximum intensity is shifting poleward.8 These changes, combined with the increasingly global nature of corporate operations and supply chains, may present significant variation in the intensity and range of physical risk exposures across capital markets in different regions.
To explore this phenomenon, Trucost analyzed the average asset level physical risk exposure of constituents in a range of S&P Global regional market indices under a moderate climate change scenario in 2050. The results presented in Table 1, Figure 1 and Figure 2 illustrate variation in the value of companies in each index that hold assets with high exposure to physical risk, the intensity of physical risk exposure within each index, and the types of physical risks that may be most important in each regional context. The physical risk scores presented represent a market capitalization weighted average of the composite physical risk scores (ranging from 1-100) for each constituent, capturing risks associated with seven climate change physical risk indicators.
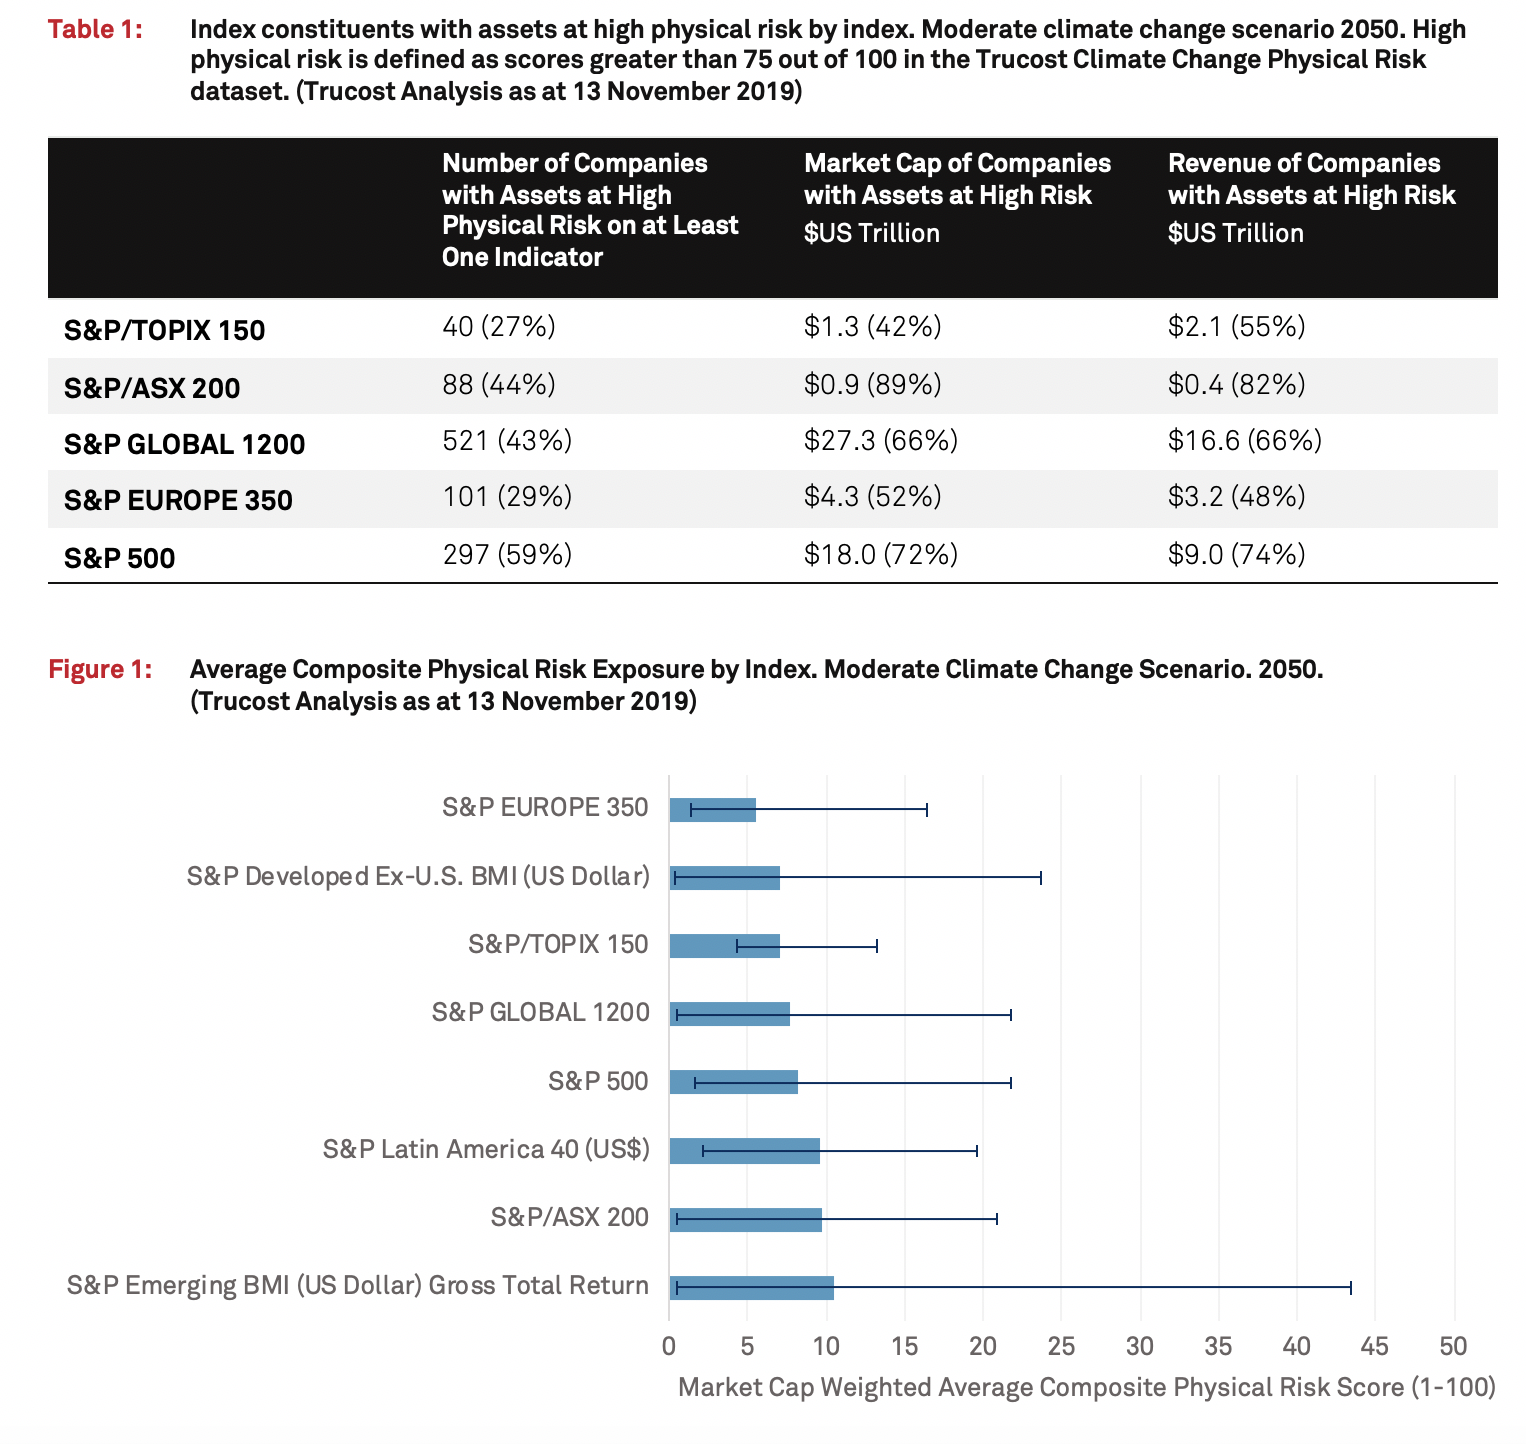
The results in Figure 1 show that average physical risk exposure is greatest in the S&P Emerging Broad Market Index and the S&P / ASX 200 indices and lowest in the S&P Europe 350, S&P Developed (Ex US) Broad Market Index and S&P/TOPIX 150 in Japan. The results also show wide variation in the risk exposures of individual companies in each index, likely due to the global operational exposures of some companies represented in each index. For example, the most exposed companies in the S&P Emerging BMI and the S&P Europe 350 indices have physical risk exposure scores of more than four and three times greater respectively than the index average in 2050. This finding highlights the importance of assessing physical risk exposure based on a company’s global asset holding, rather than simply its headquarters location.
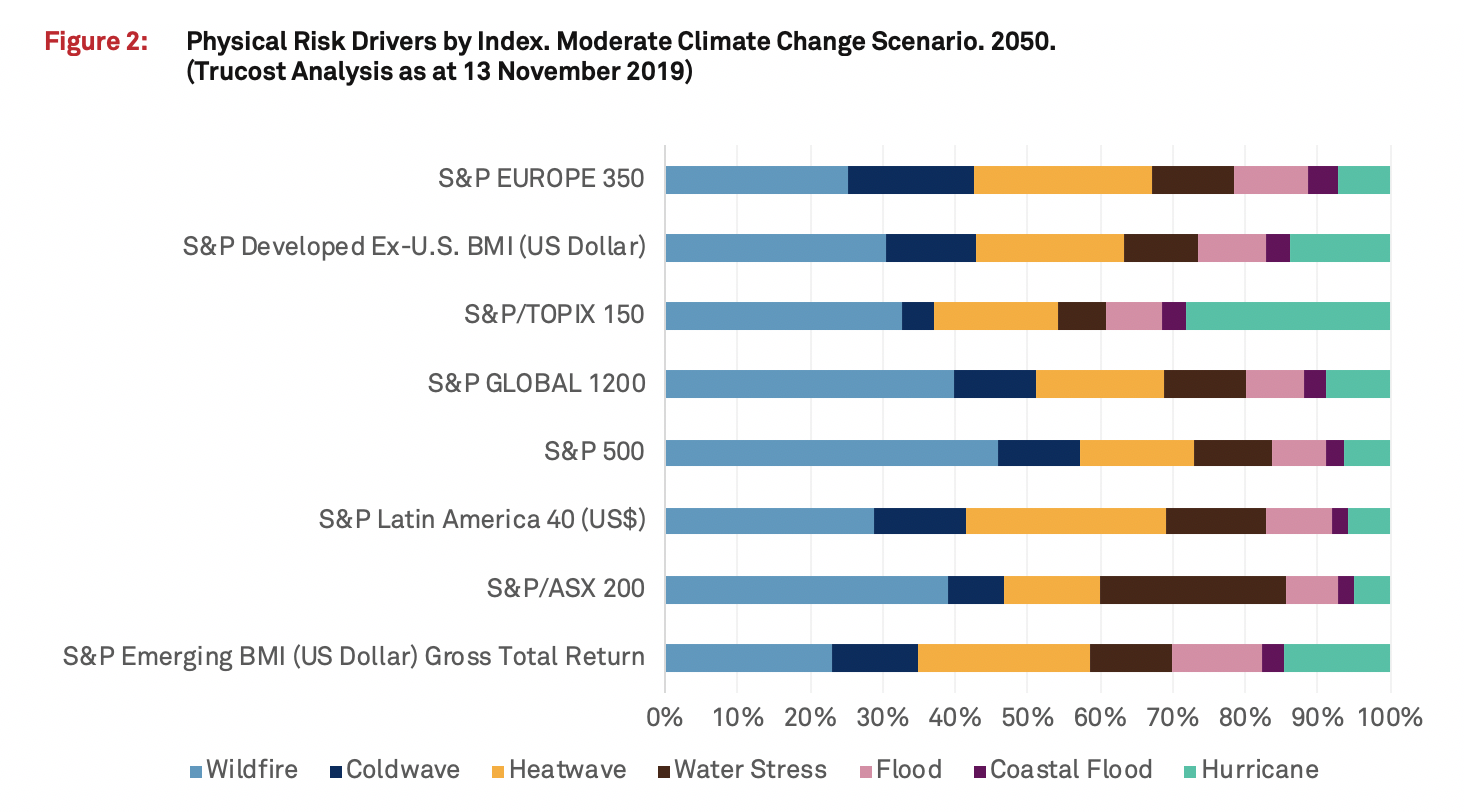
Figure 2 illustrates the drivers of climate change physical risks within each regional market index under a moderate climate change scenario in 2050. Wildfires, water stress and heatwaves linked to increasing global average temperatures represent the greatest driver of physical risk across all indices except the S&P/TOPIX 150 where wildfire, heatwave and hurricane (or typhoon) are the most important drivers.
Policies designed to limit climate change are also likely to vary widely by sector and country as governments chart a course to implement their nationally determined commitments to reduce emissions. Companies with multinational operations will be exposed to a patchwork of climate change regulations such as carbon taxes, emissions trading schemes and other fossil fuel taxes, designed to increase the cost of greenhouse gas (GHG) emissions and stimulate action by the private sector to reduce emissions. Figure 3 illustrates the average forecast carbon pricing risk per million dollars of revenue across each regional market index under a moderate climate change action scenario in 2030 and 2050. This analysis is based on Trucost’s Carbon Earnings at Risk analytics that forecasts future carbon pricing risks by geolocating company GHG emissions and matching them with scenarios for changing carbon regulations in each jurisdiction.
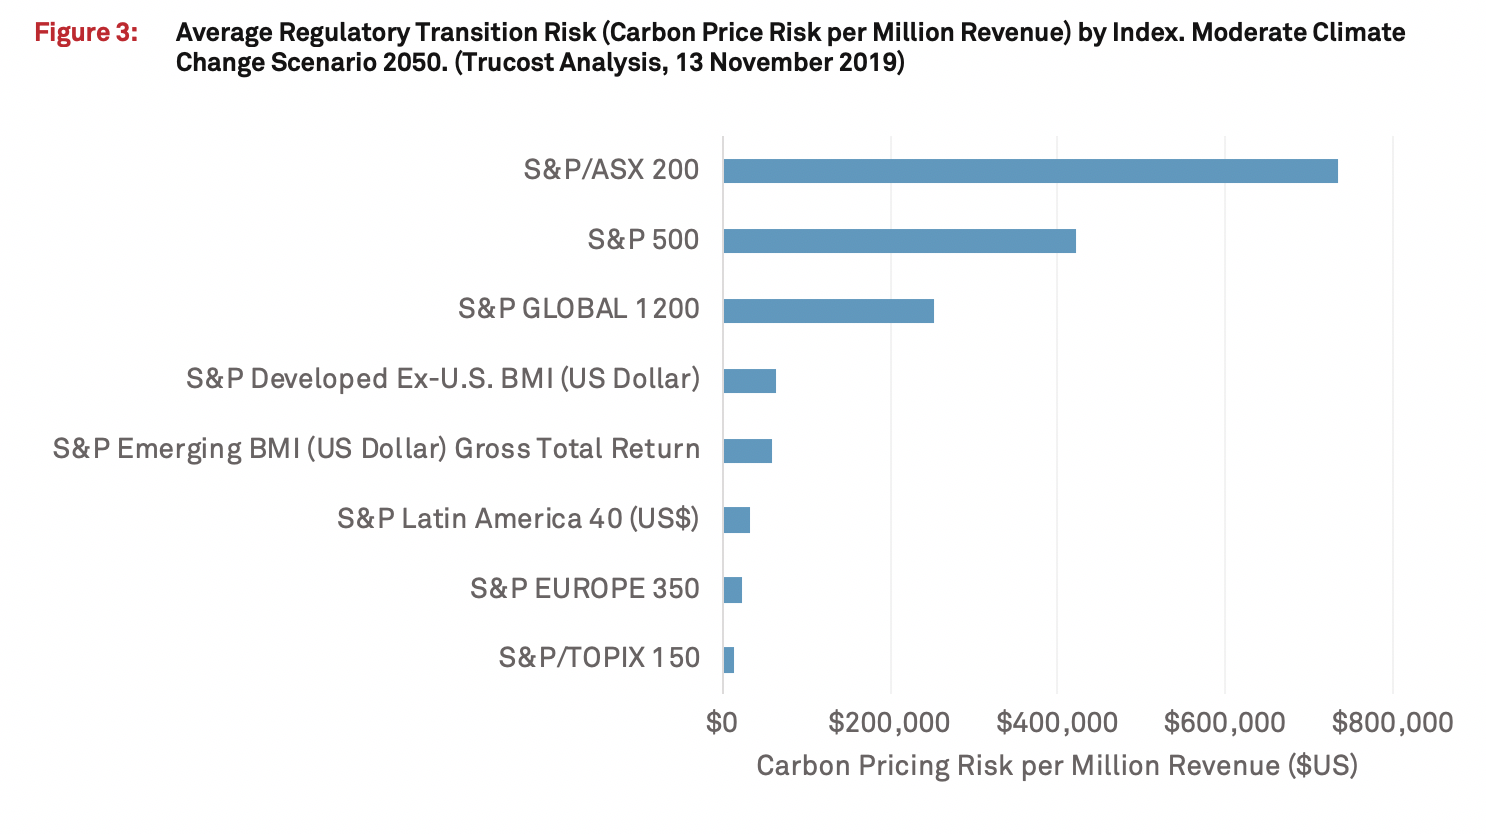
Figure 3 illustrates the average exposure of constituents in each index to transition risks associated with carbon pricing regulation, as represented by the estimated average additional carbon pricing costs per million dollars of revenue generated by each company. Exposure to carbon pricing risk is greatest in the S&P/ASX 200 in Australia and the S&P 500 in the USA, due in part to weaker carbon pricing policies in these jurisdictions today and significant action needed to limit future climate change.
Companies and investors are exposed to a balance of transition and physical risks determined by the global response to climate change. Aggressive action to limit climate change to below 2 degrees Celsius (in accordance with the Paris Agreement) would likely increase transition risks whilst reducing physical risks globally. Conversely, limited action to reduce GHG emissions would limit key transition risks (such as technology, market and regulatory risk), but would result in accelerating climate change and associated physical risks. This dynamic, combined with uncertainty around the global response to climate change, will require companies and investors to understand and plan for transition and physical risks across a range of future climate change scenarios.
Figure 4 presents an analysis of the relative exposure of S&P 500 companies to regulatory transition risks (as represented by Trucost’s Carbon Earnings at Risk analytics (carbon price risk per million dollars of revenue) and physical risk under a moderate climate change scenario in 2030. The moderate scenario (based on the IPCC RCP4.5)9 represents efforts to reduce GHG emissions by half by 2080, but is insufficient to limit climate change to less than 2 degrees by 2100. Each point on the matrix represents a single S&P 500 company, assessed for its transition and physical risk exposure based on its geographic GHG emissions profile and global asset holdings respectively.
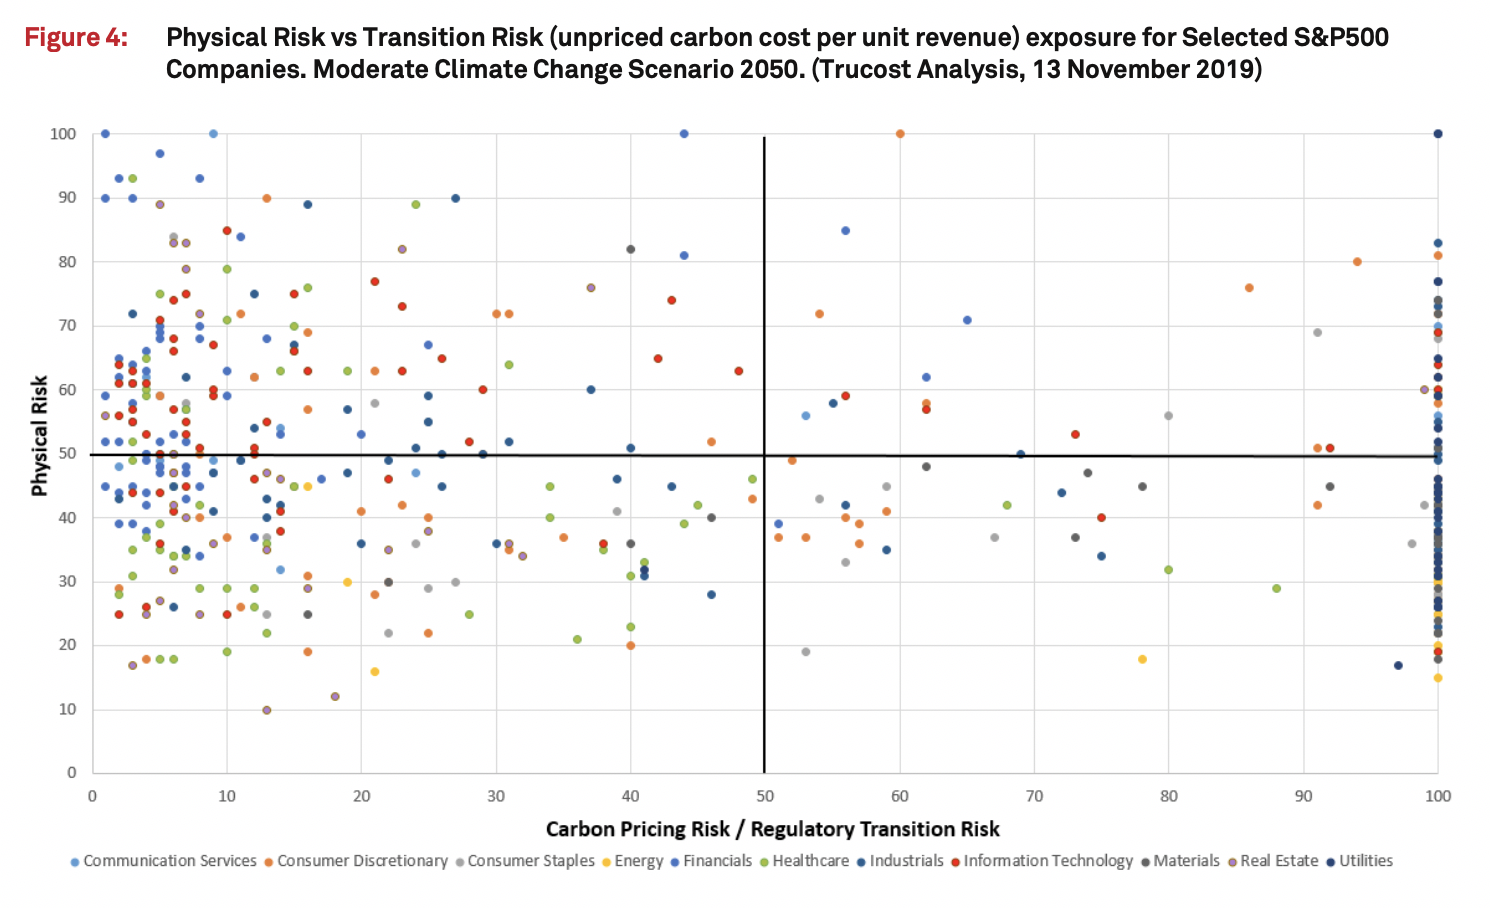
The results show significant variation in the positioning of large US companies with respect to transition and physical risks. 58% of companies fall within the bottom half of the grid with relatively lower physical risk exposure and carbon pricing risk ranging from low to high. 30% of companies fall in the top left quadrant, exposed to higher physical risk but lower carbon pricing risk, and 12% of companies fall in the top right quadrant with high exposure to the dual threats of physical and carbon pricing transition risk.
Variation in climate risk exposures do not appear to conform to clear sectoral patterns. The majority of utility sector companies are positioned to the right of the grid with high carbon pricing risk, linked to comparatively high GHG emissions intensity, and variable physical risks dependent on the location of their operations. Conversely, the majority of financials sector companies are position to the left of the grid with low carbon pricing risk, linked to comparatively low GHG intensity, and variable physical risks determined by their geographic operations. Within other sectors, the patterns are less clear with significant differences between the performance of companies on carbon pricing and physical risk within the same sector. While not inclusive of all forms of climate change risk, this analysis serves to highlight the variation in exposure to climate risks within the US equities market and the need for greater disclosure and transparency on the climate-related risks specific to each company, in line with the guidelines of the TCFD.
Asset level exposure to climate risk is a complex interplay of transition and physical risks. Company exposure and resilience does not conform to clear patterns, highlighting the need for in-depth investor analysis to evaluate climate risk at the asset and company level. Such analysis should be attentive to geographic and business sector exposures. The guidelines of the Taskforce on Climate-related Financial Disclosures (TCFD) provide companies and investors with a framework to better understand and disclose their exposure to transition and physical climate risks, in a standardized way.
The analysis presented in the paper highlights outputs of the Trucost Climate Change Physical Risk assessment methodology and dataset. This section describes the Trucost methodology for evaluating physical risk and its application at the corporate and investor portfolio level.
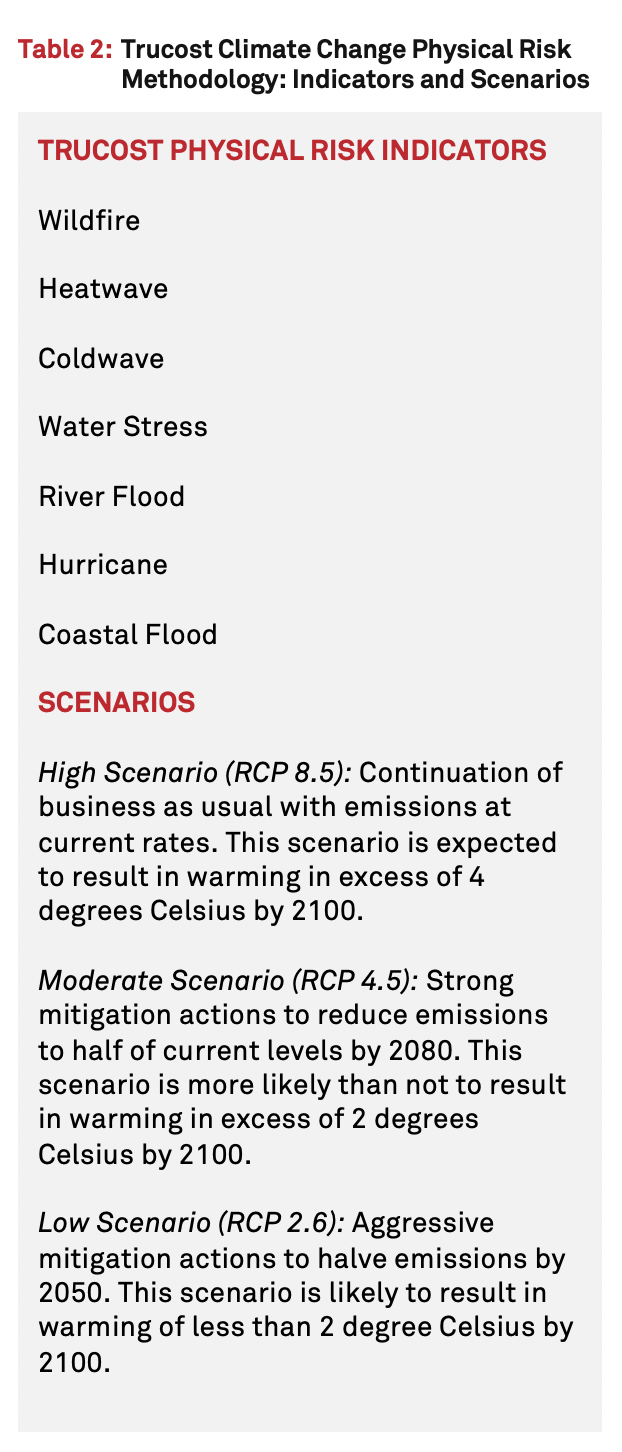
The Trucost Climate Change Physical Risk methodology characterizes corporate exposure to climate change physical risks by geolocating the assets and facilities owned by a corporate on climate change hazard maps representing the relative level of risk for each indicator across the globe. The indicators and climate change scenarios included in the analysis are described in Table 2 and based on global climate models and other datasets adapted by Trucost.10,11,12 The methodology was developed with input from experts in the investment, business and scientific communities.
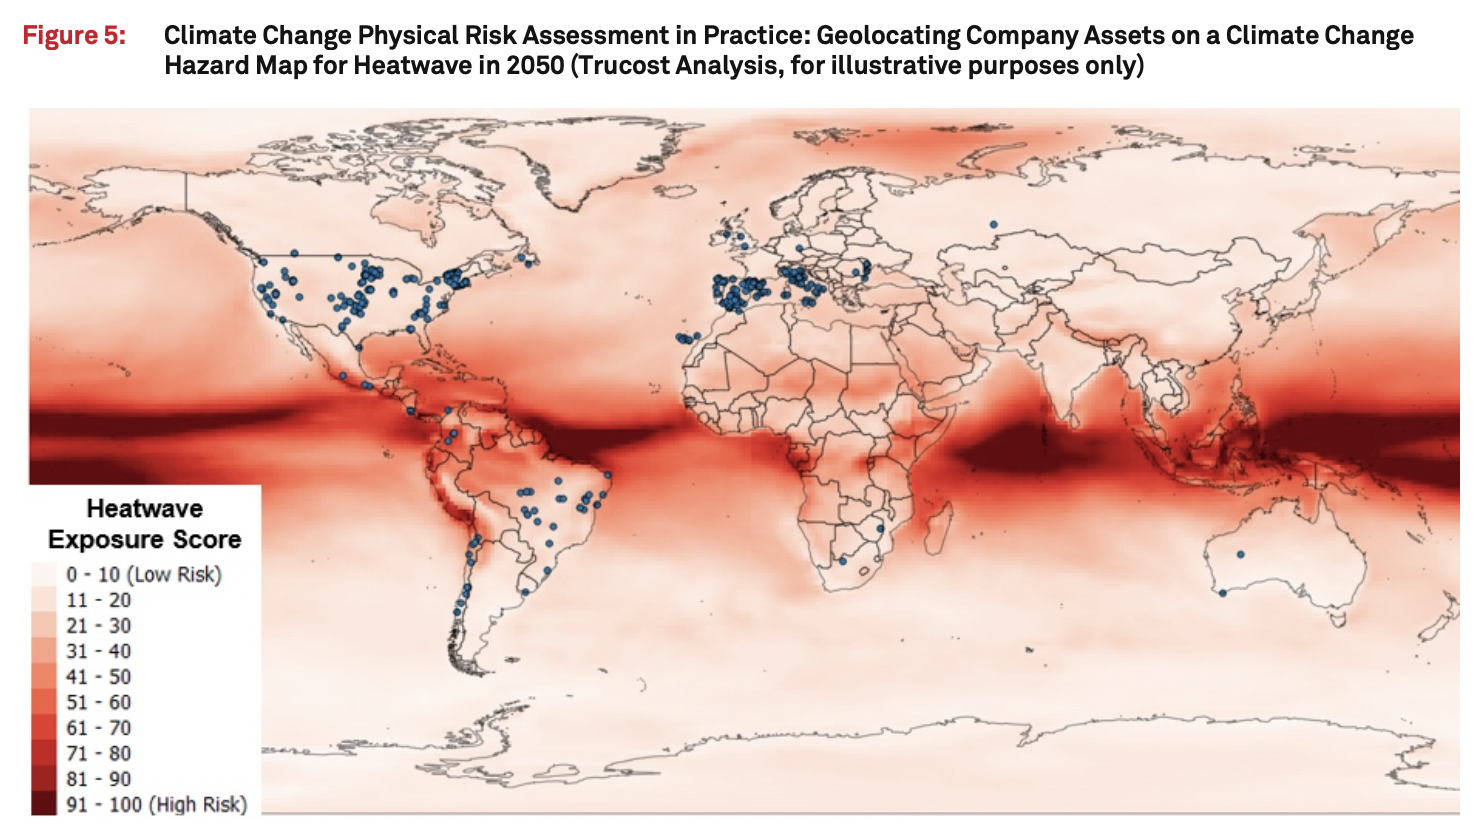
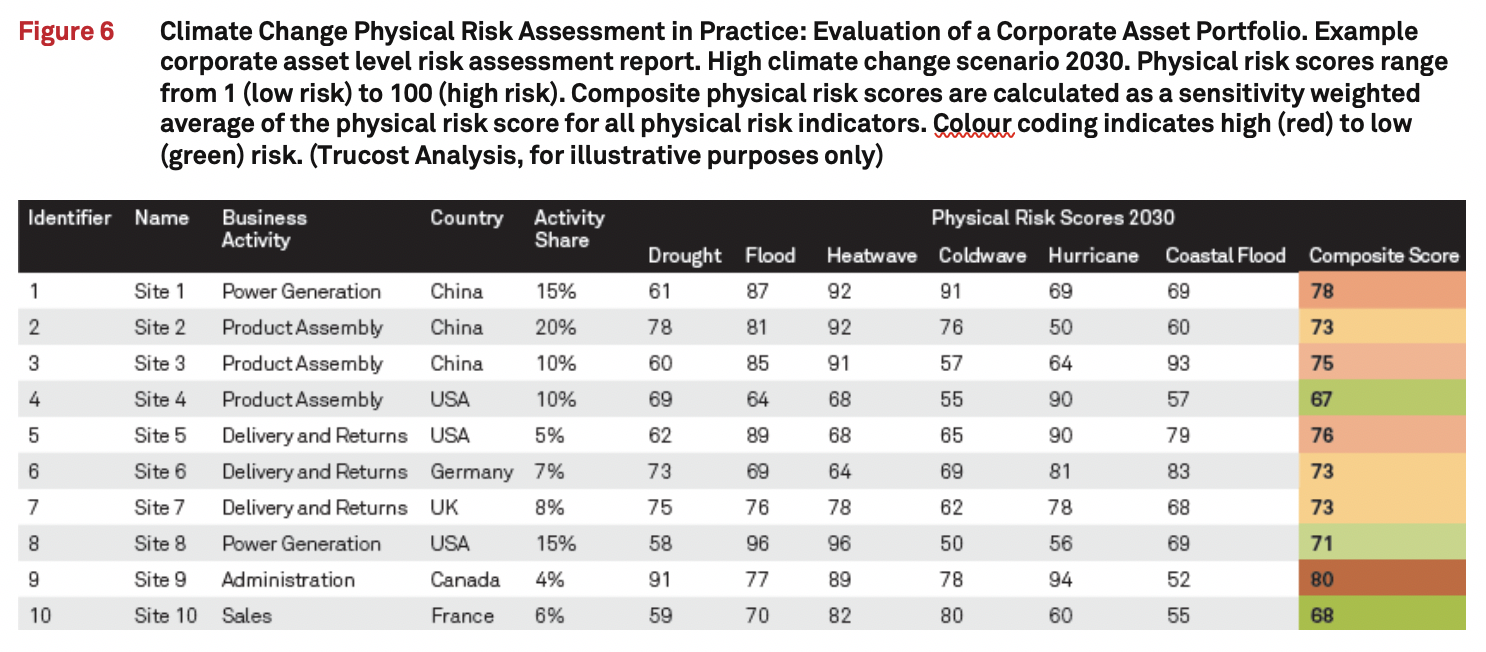
Corporate asset and headquarter locations are scored based on the level of physical risk exposure in each scenario and time period, and then aggregated to a corporate level physical risks score. The analysis draws on a database of 500,000 assets mapped to corporate owners across all regions and sectors. Company level scores are calculated as a weighted average of the physical risk score for each indicator at the headquarters location and all other operating sites of the company. A composite physical risks score is also calculated for each company based on an average of all indicators, weighted for company specific sensitivity to each physical risk type. Figure 5 presents the geolocation of operational sites for a global energy utility on a climate change hazard map for heatwaves. Figure 6 presents the output of a corporate climate change physical risk assessment highlighting key physical risks for each operating location and for the company as whole. This information can be utilized by risk managers to identify key sites at greatest physical risk, the most important risks present at each site location, key risk drivers within a regional or business unit context, and changes in risk exposures under alternative climate change scenarios. Information of this type is an important input to effective planning, management and disclosure of climate change risk management strategy.
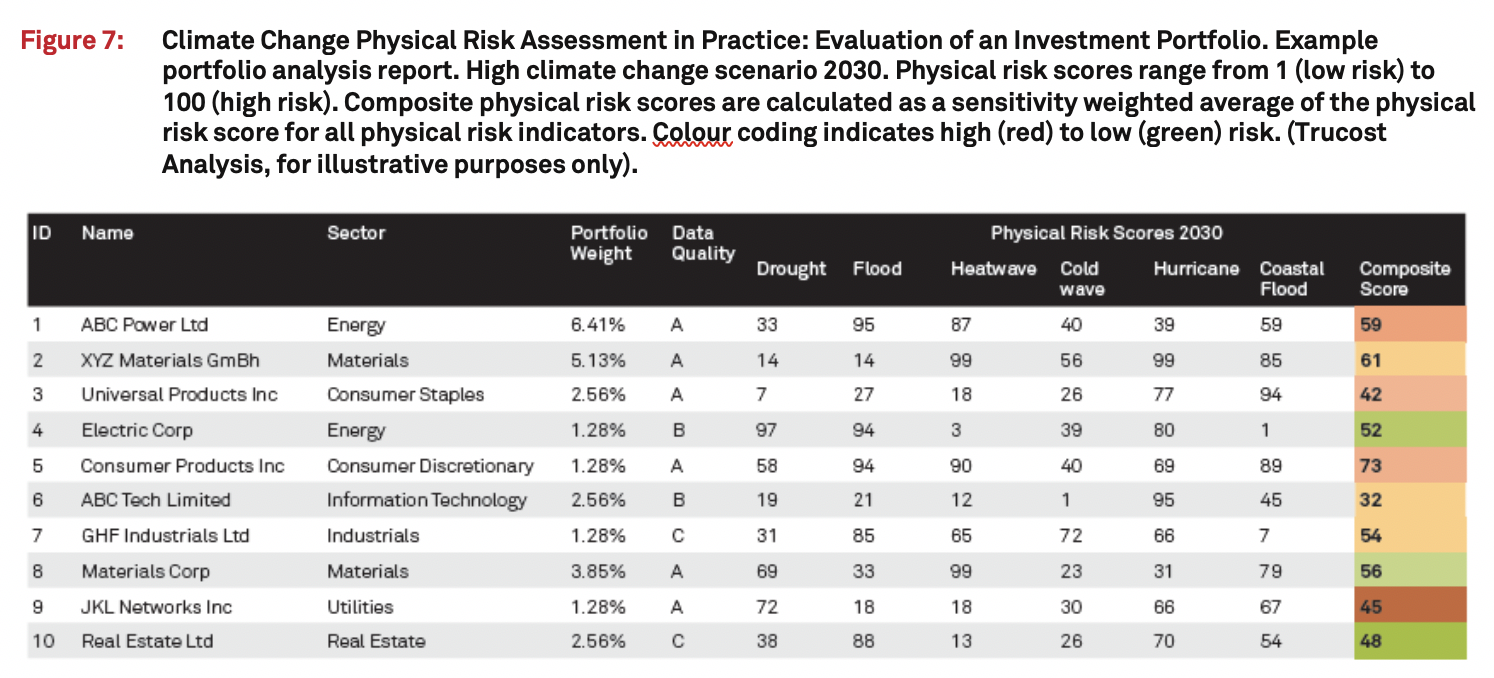
The Trucost Climate Change Physical Risk dataset covers a universe of over 15,000 companies, utilizing asset level data to assess physical risk exposure where available and modelling physical risk based on company headquarters location and geographic revenue share where necessary. This broad coverage enables the profiling and analysis of investor portfolios in comparison to benchmarks. Figure 7 presents an example analysis of an investor portfolio, highlighting the physical risk exposure of portfolio constituents and the key drivers of physical risk within the portfolio. This information can be utilized by portfolio managers to identify key portfolio constituents at greatest physical risk, the most important risk exposures for each investment, key risk drivers within the portfolio from a regional and sectoral perspective, and changes in risk exposures under alternative climate change scenarios. Information of this type can be a useful input to investment analysis, can inform engagement with investee companies on the management and mitigation of key risks, and enable the effective disclosure of climate change risks to stakeholders.
The Trucost Climate Change Physical Risk methodology and dataset will continue to evolve and improve with the integration of new asset level data and the enhancement of climate change models as new data becomes available. The methodology will also be expanded to incorporate supply chain and market climate change physical risks in early 2020 along with further enhancements to capture the financial consequences of climate change impacts at the company and portfolio level.
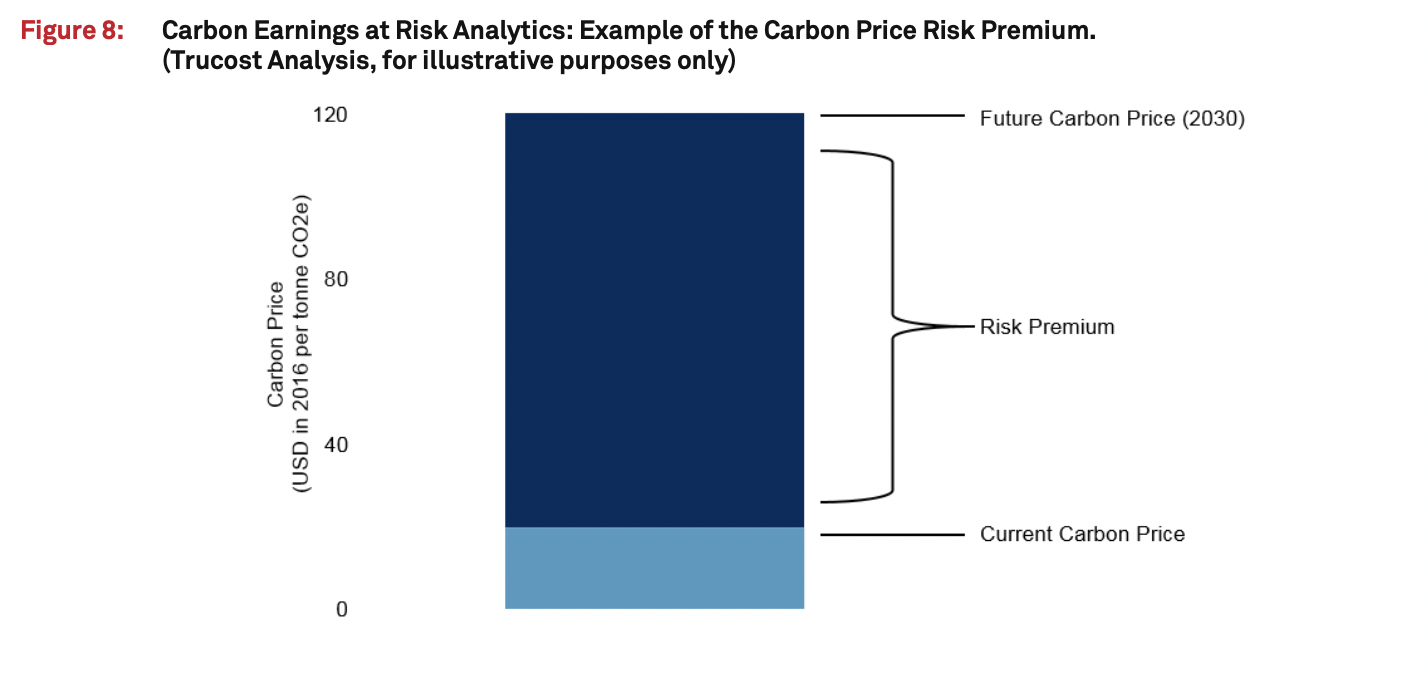
The number of carbon pricing schemes has grown rapidly over the last 10 years, however prices in most jurisdictions are currently well below the level required to achieve the Paris Agreement’s 2 degrees Celsius goal. To help companies and their investors assess exposure to future carbon pricing risk, Trucost developed Carbon Earnings at Risk analytics. The analytics are underpinned by the concept of the Carbon Price Risk Premium, representing the gap between current carbon prices and expected future prices under alternative future climate change scenarios (Figure 8). This gap varies depending on the current status of carbon pricing policies across countries and sectors, as well as the speed and degree to which prices are expected to rise in the future.13
By applying the carbon pricing risk premium to a company’s geographic GHG emissions, it is possible to quantify the additional future regulatory costs that could materialize in the transition to a low-carbon economy. This new approach to assessing carbon pricing risk allows companies and investors to conduct asset-level scenario analysis of the impact of rising carbon prices on profitability and portfolio earnings at risk in the low carbon transition.
Trucost applies Carbon Earnings at Risk Analytics to a universe of over 15,000 of the world’s largest companies, enabling the evaluation of the exposure of investor portfolios to rising carbon prices and the benchmarking of corporate performance relative to peers. Further information is available in the Trucost publication ‘TCFD Scenario Analysis: Integrating Future Carbon Price Risk’.14
We acknowledge the World Climate Research Programme’s Working Group on Coupled Modelling, which is responsible for CMIP, and we thank the climate modeling groups for producing and making available their model output. For CMIP the U.S. Department of Energy’s Program for Climate Model Diagnosis and Intercomparison provides coordinating support and led development of software infrastructure in partnership with the Global Organization for Earth System Science Portals.
Trucost also acknowledges and thanks DWS Group for its input to the preparation of this paper and the development of the climate change physical risk assessment methodology.
Trucost is part of S&P Global. A leader in carbon and environmental data and risk analysis, Trucost assesses risks relating to climate change, natural resource constraints, and broader environmental, social, and governance factors. Companies and financial institutions use Trucost intelligence to understand their ESG exposure to these factors, inform resilience and identify transformative solutions for a more sustainable global economy. S&P Global's commitment to environmental analysis and product innovation allows us to deliver essential ESG investment-related information to the global marketplace. For more information, visit www.trucost.com.
DWS Group is a leading asset manager with €752 billion in assets under management as of 30 September 2019. DWS Group is headquartered in Germany with ~3,400 employees globally providing a range of traditional and alternative investment capabilities worldwide. DWS Group serves a diverse client base of retail and institutional investors worldwide, with a strong presence in its home market in Germany.
trucostinfo@spglobal.com
The Americas
+1 800 402 8774
Europe, Middle East & Africa
+44 20 7160 9800
Asia-Pacific
+852-2533-3565
©2019 S&P Trucost Limited (“Trucost”), an affiliate of S&P Global Market Intelligence. All rights reserved.
The materials have been prepared solely for informational purposes based upon information generally available to the public and from sources believed to be reliable. No content contained in these materials (including text, data, reports, images, photos, graphics, charts, animations, videos, research, valuations, models, software or other application or output therefrom or any part thereof (“Content”) may be modified, reverse engineered, reproduced or distributed in any form or by any means, or stored in a database or retrieval system, without the prior written permission of Trucost. Trucost, its affiliates and their licensors do not guarantee the accuracy, completeness, timeliness or availability of the Content. Trucost, its affiliates and their licensors are not responsible for any errors or omissions, regardless of the cause, for the results obtained from the use of the Content. THE CONTENT IS PROVIDED ON AN “AS IS” BASIS. TRUCOST, ITS AFFILIATES AND LICENSORS DISCLAIM ANY AND ALL EXPRESS OR IMPLIED WARRANTIES, CONDITIONS, INCLUDING, BUT NOT LIMITED TO, ANY WARRANTIES OF MERCHANTABILITY OR FITNESS FOR A PARTICULAR PURPOSE OR USE, FREEDOM FROM BUGS, SOFTWARE ERRORS OR DEFECTS, THAT THE CONTENT’S FUNCTIONING WILL BE UNINTERRUPTED OR THAT THE CONTENT WILL OPERATE WITH ANY SOFTWARE OR HARDWARE CONFIGURATION. In no event shall Trucost, its affiliates or their licensors be liable to any party for any direct, indirect, incidental, exemplary, compensatory, punitive, special or consequential damages, costs, expenses, legal fees, or losses (including, without limitation, lost income or lost profits and opportunity costs) in connection with any use of the Content even if advised of the possibility of such damages.
Neither Trucost, nor any of its affiliates, nor any of their respective directors, officers, employees, partners or licensors make any claim, prediction, warranty or representation whatsoever, expressly or impliedly, either as to the results to be obtained from the use of any Content or the fitness or suitability of any Content for any particular purpose to which they might be put.
Neither Trucost, nor any of its affiliates nor any of their respective directors, officers, employees, partners or licensors provide investment advice and nothing in these materials nor should any links thereto be taken as constituting financial or investment advice or a financial promotion. Neither Trucost, nor any of its affiliates nor any of their respective directors, officers, employees, partners or licensors make any representation regarding the advisability of investing in any asset. A decision to invest in any such asset should not be made in reliance on any information herein. Inclusion of an asset in a report is not a recommendation to buy, sell or hold that asset. The general information contained in these materials or any links thereto should not be acted upon without obtaining specific legal, tax, and investment advice from a licensed professional.
All opinions and forecasts are as of the date of this research report and are subject to change at any time. Past performance may not be indicative of future results. There is no assurance that forecasts may come to pass.
Murray Birt is not affiliated with TruCost or any of its affiliates. The views expressed herein are not necessarily those of DWS and are subject to change without notice. DWS and TruCost are not affiliated.
US: I- 071408-1 (11/19) CRC: 071412

