Discover more about S&P Global’s offerings
Published: July 6, 2020
The landmark Paris Agreement marked a sea change in the global fight against climate change.1 Backed by empirical evidence from the UN Intergovernmental Panel on Climate Change (IPCC), ambition has since grown to limit global temperature rise to 1.5°C since pre-industrial levels.
To date, climate-conscious investors have largely focused on reducing relative portfolio carbon exposure, but divergent methodologies have made fertile ground for so-called “greenwashing.” While point-in-time analyses do not necessarily inform alignment with our needed transition to a low-carbon economy. However, a combination of groundbreaking new datasets and index innovation is emerging. Investors now have the choice to align with a scenario that may mitigate the most catastrophic impacts. The European Union (EU) is in the process of finalizing standards for defining a Climate-Transition Benchmark (CTB) and a Paris-aligned Benchmark (PAB), both of which use absolute measures to align with a 1.5°C trajectory rather than simply a relative carbon reduction.2 Our S&P PACTTM: Paris-Aligned & Climate Transition Indices offer a powerful set of investment solutions to meet the proposed standards, in addition to other climate objectives. This new breed of sustainable climate indices therefore provides a pathway for investors to:
This paper underscores how the S&P PACT Indices could help investors transition to a 1.5°C world and achieve other climate objectives.
Few climate scientists would dispute the Earth’s climate is rapidly warming due to human activity, with potentially catastrophic impacts.3 Many are therefore committed to reducing greenhouse gas (GHG) emissions, and the goal is now not only the well below 2°C target of the Paris Agreement, but less than 1.5°C of warming since pre-industrial levels.4 Indeed, climate models reveal an ominous non-linear relationship between GHG emissions and several climate tipping points, which could set off dramatic and irreversible effects. For example, just 1-3°C of warming could melt the entire Greenland ice sheet, triggering a reversal in Atlantic Ocean currents, amounting to sea-level rise, heat accumulation in the Southern Ocean and, ultimately, further ice loss from the East Antarctic ice sheet.5 At higher levels of global warming, we would see even more severe consequences of this nature.6
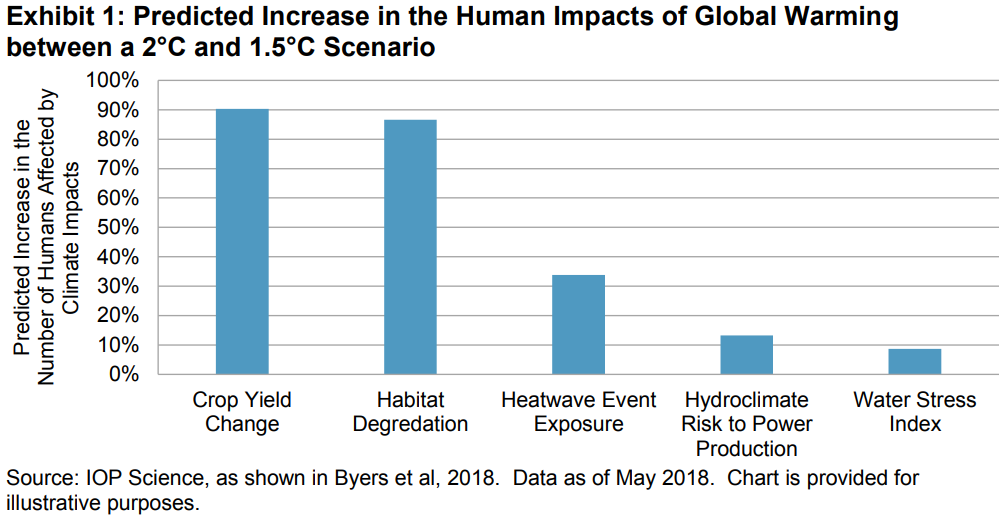
The human implications of these complex and unprecedented interactions are potentially disastrous. With a rise of 2°C, significantly more people will likely face reduced crop yields, habitat degradation, heatwave exposure, hydro-climate risk to power production, and water stress than with 1.5°C of warming (see Exhibit 1). It seems that just an additional 0.5°C of warming between these two scenarios could have exponentially more devastating human consequences, let alone at higher warming scenarios.
In January 2020, global land and ocean surface temperature was recorded at its highest level in 141 years, at 1.14°C above the 20th century average (NOAA National Centers for Environmental Information, 2020). However, snap assessments like these do not paint a complete picture, given the non-linear complexities of the climate system. Thus, it begs the question, what trajectory are we on and is it aligned with a 1.5°C scenario?
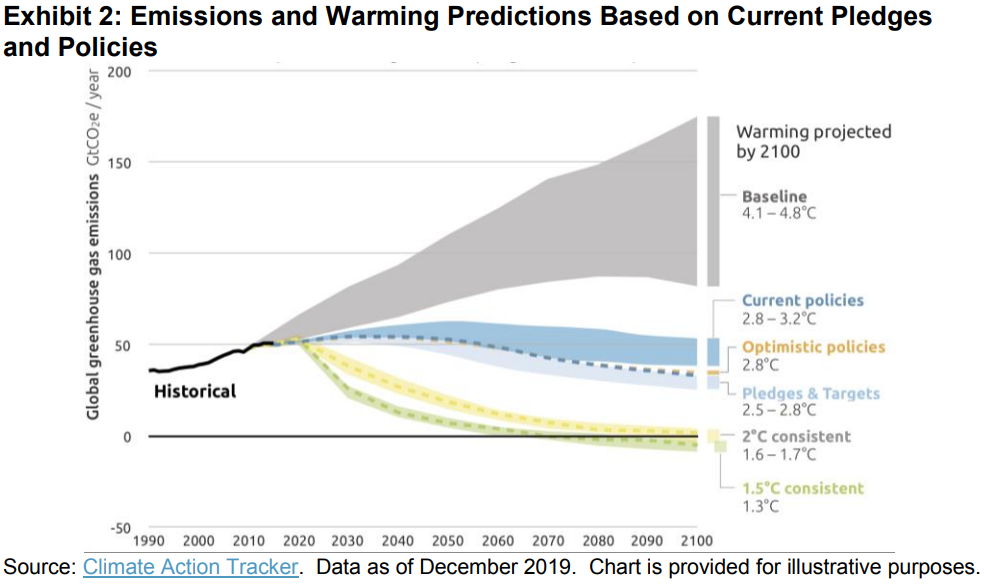
In the absence of corrective action, global warming is expected to reach 4.1°C-4.8°C above pre-industrial levels by the end of this century.7 Under current policies, moderate estimates suggest that we are still likely to emit more than double the levels required to achieve a 1.5°C scenario by 2030 (see Exhibit 2). Ultimately, the answer will depend on the behavior of governments, policymakers, and market participants alike to transform the status quo and radically transition to a lower-carbon economy. From an investor’s perspective, this includes decisions on how and where to allocate their capital—as well as the benchmarks used to evaluate their investment performance.
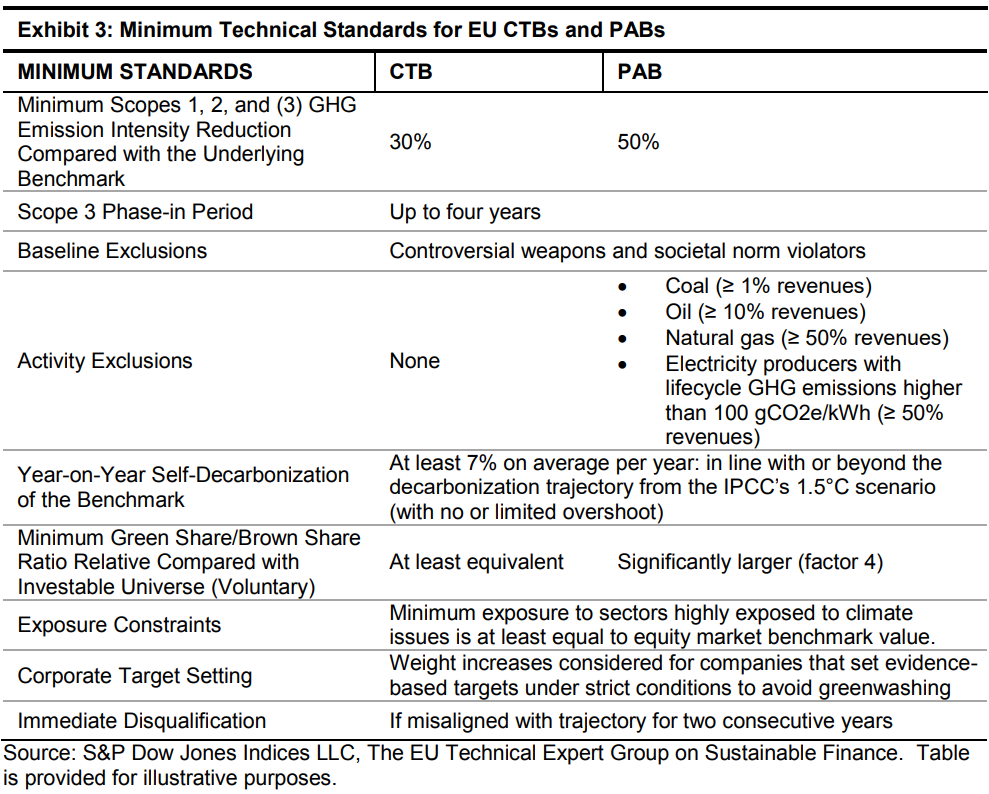
In March 2018, the European Commission published its action plan8 to reorient capital flows toward investment for “sustainable and inclusive growth.” Key to this will be increased private sector environmental and climate-related expenditure. To this end, the EU is in the process of introducing minimum standards for two new climate benchmark labels to align investments with a 1.5°C trajectory and prevent climate index greenwashing. Specifically, these are the Climate Transition Benchmarks (CTBs) and Paris-aligned Benchmarks (PABs), both of which use absolute measures of becoming 1.5°C scenario compatible rather than simply a relative carbon reduction.
To ensure the labels are reliable and easy to recognize, only administrators that comply with the regulatory requirements can use them when marketing climate benchmarks in the EU. Exhibit 3 summarizes the current proposed minimum standards from the EU-appointed TEG’s final report for each of these new labels.9
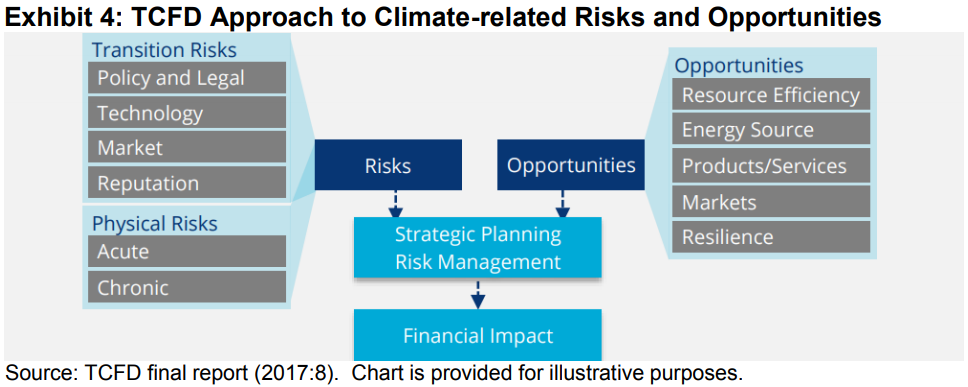
Beyond the EU, global initiatives such as the G20’s Task Force on Climate-related Financial Disclosures (TCFD) have also sought to enhance market transparency on climate risks and opportunities to support sustainable investment. The TCFD’s final report10 gave recommendations for corporate and investor climate disclosure and underscored the importance of reporting on the financial impacts of climate-related risks and opportunities—comprising both transition and physical climate risks (see Exhibit 4).
Physical climate risks include more frequent and severe extreme weather events such as storms, hurricanes, and floods (acute impacts), as well as shifts in long-term weather patterns and sea-level rise (chronic impacts). Physical risk thereby threatens companies potentially facing asset write-downs, disruptions in supply chains, and costly insurance premiums for high-risk locations. Transition risk, on the other hand, refers to the costs associated with the policy, legal, technological, and reputational risks from adapting to climate change. For example, if policymakers attempt to curb emissions with carbon taxes and emission trading schemes, certain companies may face higher operating costs that they may not be able to pass on. These might encourage them to substitute products or technologies for low-carbon alternatives that could create technological risk if assets are retired early. Meanwhile, shifts in consumer preferences and reputational damage to companies that are slow to adapt to a transition might erode brand value and ultimately decrease revenues. However, a transition to a low-carbon economy will likely create both winners and losers. A successful transition is expected to require about USD 1 trillion of investment each year in gainful areas such as low-carbon energy, resource efficiency, and sustainable products.11
Transition and physical climate risks are not a priori connected. As the science points out, failure to transition to a low-carbon economy would increase the likelihood and severity of physical risks. While failure to mitigate physical risks would seem to suggest the market is not adequately transitioning. Even under a 1.5°C scenario, physical climate risks will likely occur more frequently and cause more damage than they do now. Neglecting both types could result in less climate risk mitigation than a standard market-cap-weighted index. A holistic, climate-aligned strategy, incorporating TCFD recommendations, must therefore address types of climate risk, as well as the opportunities arising from climate change.
To meet the EU’s proposed minimum standards for CTBs and PABs, we have launched two new index series: the S&P Paris-Aligned Climate (PA) Indices and S&P Climate Transition (CT) Indices, respectively, collectively referred to as the S&P Paris-Aligned and Climate Transition (PACT) Indices. Both methodologies meet the respective EU requirements12 and other climate objectives to become compatible with a 1.5°C scenario and recommendations from the TCFD (see Exhibit 5).
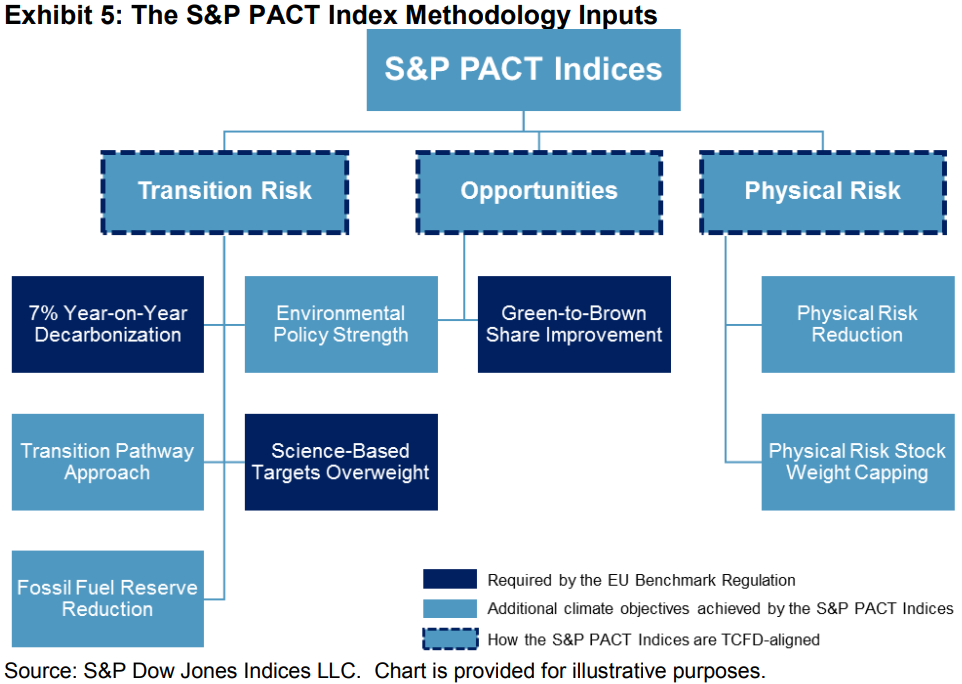
The S&P PACT Indices’ Methodology is rooted in transition risks, physical risks, and the opportunities from climate change, as recommended by the TCFD. This, in addition to the inclusion of several other climate objectives, means the methodology goes beyond the EU’s proposed minimum standards to provide an even more robust and holistic investment solution for transitioning to a 1.5°C world. It achieves all of these objectives simultaneously, through an optimization that minimizes deviations from the underlying index, which has historically resulted in a broad and diversified index with similar performance to the benchmark. The various climate objectives included as inputs into the methodology are as follows.
The S&P PACT Indices use forward-looking data and models from Trucost, part of S&P Global, to assess the GHG emissions of each constituent and their GHG emissions compared with a 1.5°C scenario compatible budget. These budgets may be set in two ways—both of which were developed by leading academics14 and are supported by the SBTi.
The budgets reflect a company’s share of the required decarbonization rate for the world to transition to a 1.5°C scenario from each company’s base-year emissions. For example, if all nations were to cut their GHG emissions per unit of GDP by 5% per year, global GHG emissions would be 50% lower in 2050 than in 2010, so long as the economy continues to grow at its historical rate of 3.5% per year.15 As such, this suggested 5% year-on-year reduction may be translated into individual company budgets based on their GHG emissions per unit of value-added (gross profit) to the global economy, otherwise known as the GEVA approach.16 This approach is used when companies have diverse business activities, or when their business activities do not have established transition pathways defined by IEA climate scenario models.
However, for companies with operations concentrated in certain high-emitting activities, sector-specific budgets are defined in terms of a given unit of output (for example, tons of carbon and carbon equivalents (tCO2e) per ton of crude steel produced). This method, known as the Sectoral Decarbonization Approach (SDA),18 permits sectors to decarbonize at varying speeds, depending on the opportunities available given the current technologies within each sector.
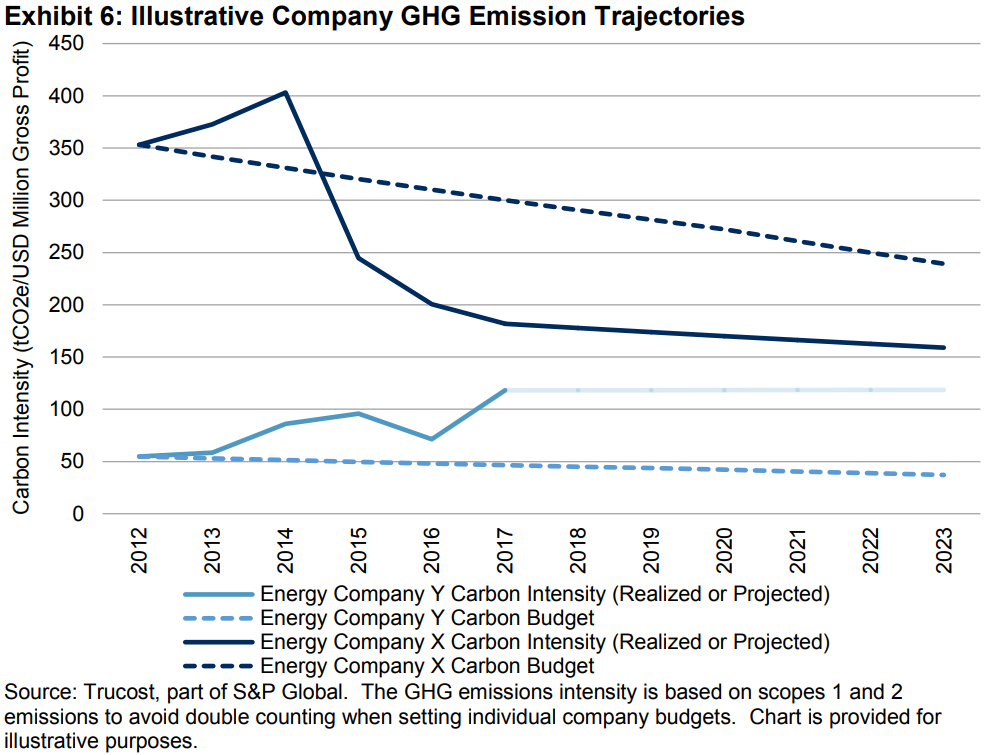
Together, these budgets assign each company a maximum amount of emissions each year. Trucost compares these budgets with forward-looking estimates and realized GHG emissions for companies. Exhibit 6 illustrates what the individual company emission trajectories might look like. In this way, Trucost models company emissions toward a trajectory consistent with a 1.5°C scenario in their transition pathway models. This enables the S&P PACT Indices to reweight companies, so the index as a whole is 1.5°C compatible, on a forward-looking basis, at rebalance.
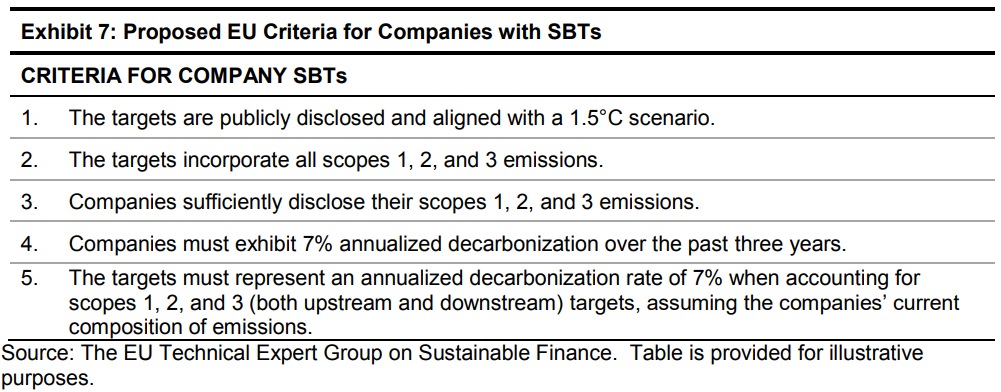
To enhance exposure of companies aligned with a 1.5°C scenario, the S&P PACT Indices overweight companies with publicly disclosed science-based targets (SBTs) that adhere to the following criteria (see Exhibit 7), as per the EU’s proposed minimum standards, to prevent climate index greenwashing.
If a company discloses SBTs, it demonstrates that it is actively thinking about and managing its transition to a low-carbon future and is thus more likely to succeed in reducing its exposure to transition risks. However, any company that discloses SBTs must be held accountable to ensure it achieves what it claims to do. Hence, the importance of setting such stringent criteria before overweighting companies in climate indices seeking either EU CTB or PAB labels. The S&P PACT Index Series rewards companies that meet the above criteria by increasing their standing in the index with at least a collective 20% overweight. This collective overweight function allows for some companies to be overweighted by more than this and potentially for some to be underweighted. This thereby provides the flexibility required to incorporate numerous other climate objectives in the S&P PACT Index Series Methodology.
The EU’s proposed minimum standards provide up to a four-year grace period for phasing in scope 3 emissions. However, the S&P PACT Indices’ Methodology includes scopes 1, 2, and 3 from the start.19 Both upstream and downstream scope 3 emissions are key to understanding a complete picture of company emissions throughout the value chain. This is especially true since the ratio of scopes 1 and 2 emissions with scope 3 emissions is not constant across sectors. As such, incorporating scope 3 emissions helps to ensure a more holistic assessment of a company’s overall transition risk.
In addition to the primary goal of transitioning to a 1.5°C scenario, the EU’s proposed minimum standards espouse a principle of “Do No Significant Harm” (DNSH). At the security level, this means ensuring that the pursuit of environmental objectives is not at the expense of social norms. Thus, the proposed standards demand baseline exclusions of companies with direct controversial weapons exposure and companies at risk of violating global social norms, measured by their performance against the principles of the UN Global Compact. At the activity level, the DNSH principle instructs that contributing to one environmental objective should not significantly harm any other environmental objectives. As such, the regulation requires the exclusion of companies embroiled in controversies arising from practices that significantly harm one of several environmental objectives.20
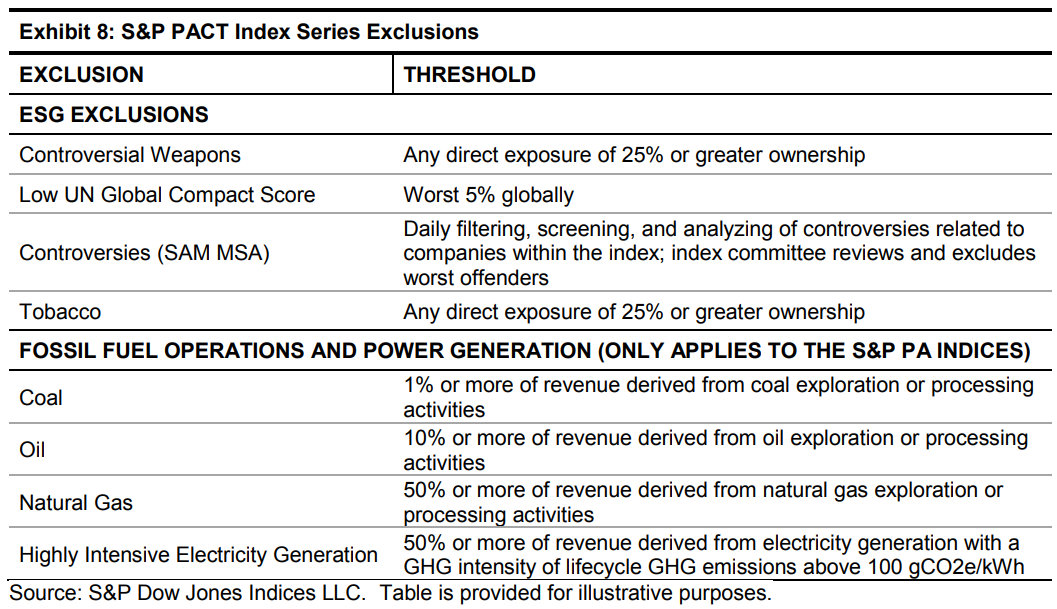
To meet the EU’s proposed minimum standards, the S&P PACT Indices make the above exclusions, and go even further—by additionally excluding companies with direct exposure to tobacco and those involved in material public controversies pertaining to broader environmental, social, and governance (ESG) issues, not just the various environment-related controversies stipulated, for a more sustainable climate index.21 Further, unrelated to the DNSH principle, benchmarks seeking to obtain the more ambitious EU PAB label must additionally exclude various fossil fuel and power generation companies based on business activities. Exhibit 8 describes the exclusions of the S&P PACT Indices in detail.
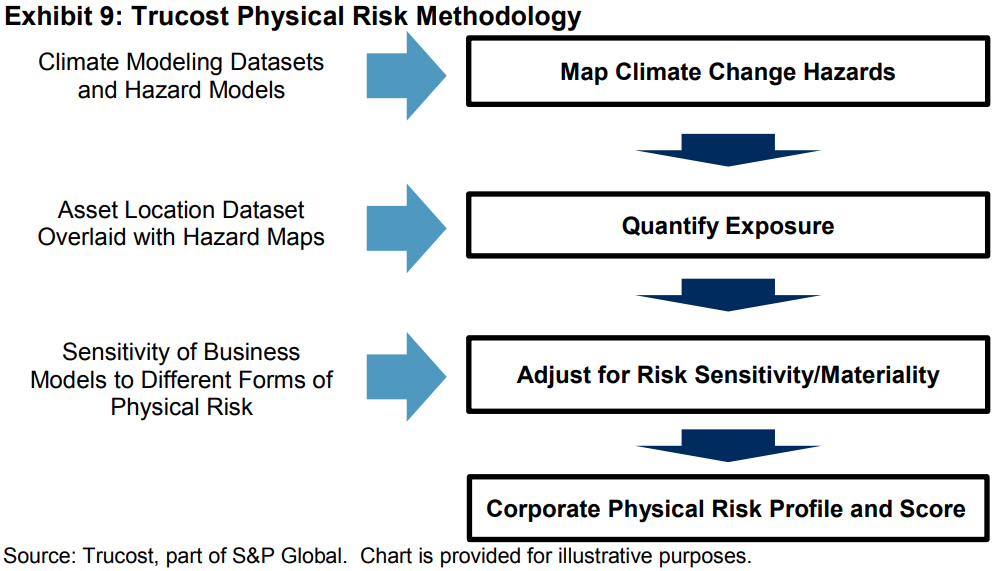
Unlike transition risk, which can affect companies in any location, specific locations have increased likelihood of physical climate risk. Thus, climate modeling datasets and hazard models must be coupled with geolocation-specific, asset-level data. Trucost’s climate change physical risk dataset—which includes the impact of wildfires, cold waves, heatwaves, water stress, sea-level risk, floods, and hurricanes—is unparalleled in this regard, within investable products.
Exhibit 9 summarizes Trucost’s physical risk methodology. In addition to assessing a company’s exposure to physical climate risks, Trucost also determines a company’s sensitivity to these risks, based on the types of asset and business operations affected. For example, an IT firm’s corporate offices are generally less sensitive to water stress than a food and beverage company’s manufacturing plants, as the former is much less heatwaves due to falling worker productivity and overheating equipment.
Trucost’s dataset allows the S&P PACT Index Series to go beyond the requirements of the EU CTB and PAB labels, capping individual company exposure to physical risk and reducing the physical climate risk exposure of the index overall. The former helps to mitigate tail risk from acute climate hazards, such as hurricanes and wildfires, while the latter serves to mitigate the long-term effects of chronic physical risks like rising sea levels.
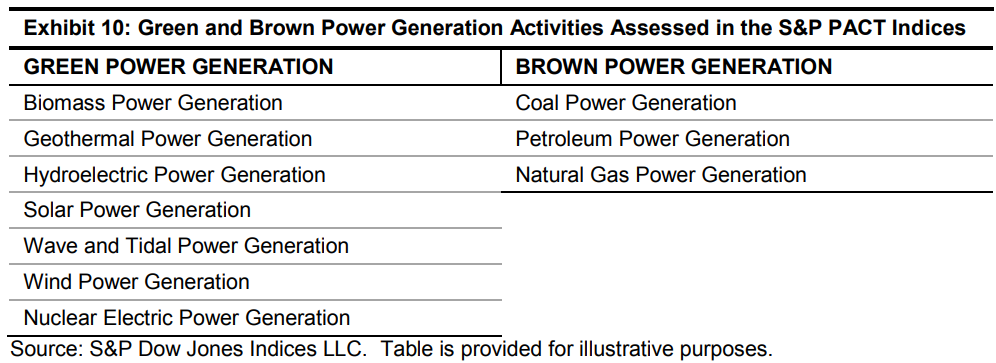
From an investor’s perspective, the consequences of climate action (or lack thereof) can lead to both gains and losses. Ignoring the opportunities does not allow investors to benefit from the low-carbon transition. For example, while a 1.5°C scenario implies fossil fuels would need to fall from 83% of primary energy in 2020 to about 33% in 2050, the slack will likely be picked up by renewables, expected to grow from 15% to about 60% over the same period.22 To account for this, the S&P PA Indices make adjustments to companies’ weights that are involved in power generation, improving the green-to-brown ratio by overweighting companies with more revenues from green power generation activities relative to brown. The weights are accounted for so that the green-to-brown ratio of the index is either maintained in the S&P CT Indices or improved by at least a factor of four for the S&P PA Indices, relative to the underlying benchmark. These adjustments further demonstrate the holistic approach that has been adopted to align the S&P PACT Indices with recommendations from the EU-appointed TEG and the TCFD (see Exhibit 10).
To deepen alignment with the TCFD framework, the S&P PACT Indices go beyond the EU’s proposed minimum standards and incorporate the following additional objectives for a more holistic approach to transition risk.
i. Mitigating Stranded Asset Risk: To mitigate the possibility of exposure to costly asset write-downs, the S&P PA Indices reduce the fossil fuel reserve exposure by a minimum of 80%, while the S&P CT Indices maintain exposure so it is no worse than the underlying index. This is important because the achievement of even a 2°C scenario requires that 80% of all known—proven and probable—fossil fuel reserves must remain firmly within the ground.23 The reason for this is that the GHG emissions that would otherwise be released from their combustion would be so significant that the resultant rise in global temperatures would likely far exceed 2°C of warming since pre-industrial levels. Thus, for the more ambitious goal of transitioning to a 1.5°C world, the curbing of fossil fuels must be even greater. However, still to this day, the valuations of fossil fuel companies tend to assume that these reserves—listed as assets on company balance sheets—will eventually be realized. To the extent that carbon-limiting regulation is successful in achieving the goals of the Paris Agreement (let alone more stringent climate action), these assets may become “stranded,” implying a potentially systemic mispricing of fossil fuel companies as currently overvalued—with potential risk for any investment strategy that continues to hold them.
ii. Environmental Policy Strength: Companies with strong environmental policies are arguably better equipped to deal with the risks posed by the low-carbon transition. For this reason, the S&P PACT Indices seek to improve (PAB label) or maintain (CTB label) environmental policy strength, as measured by the S&P DJI Environmental Score. This score provides insights into the financially material aspects of a company’s climate strategy, environmental policy and management systems, electricity generation, environmental business risks and opportunities, low-carbon strategy, recycling strategy, co-processing, and more. The S&P PA Indices ensures a weighted average increase of S&P DJI Environmental Score relative to the underlying index by 20% of the possible improvement. The S&P CT Indices prevents any worsening of environmental policy strength. S&P DJI Environmental Scores, available through S&P DJI ESG Scores,24 are based upon the renowned SAM Corporate Sustainability Assessment, which ranks as the highest quality among ESG rating providers, according to leading sustainability professionals (Rate the Raters Survey, SustainAbility, 2019).25
In the S&P PACT Indices Methodology, the climate objectives discussed thus far serve as optimization constraints—where the objective function is to minimize active share while accommodating the climate requirements.
This matters especially because a transition to a 1.5°C world will likely require an absolute reduction in global GHG emissions. Thus, in addition to an initial 30% and 50% carbon reduction relative to the underlying index for the CTBs and PABs, respectively, the EU’s proposed minimum standards require a 7% year-on-year self-decarbonization. This target is unrelated to the emissions trajectory of the underlying benchmark. This means that at any given point in time, the precise decarbonization of the index relative to the benchmark is unknown. For this reason, minimizing active share helps to reduce the impact of the absolute decarbonization—which is needed to align with a net-zero emissions pathway by 2050 (i.e., a 1.5°C scenario)—on tracking error.
Exhibit 11 illustrates the potential future carbon intensity trajectories for the CTBs, PABs, and the underlying benchmark (top panel), as well as the implications of the emissions trajectory of the underlying benchmark on the relative carbon intensity reduction that will be required for the CTBs and PABs (bottom panel). Note the initial reductions of 30% and 50% emissions relative to the underlying benchmark for the CTB and PAB versions, respectively.
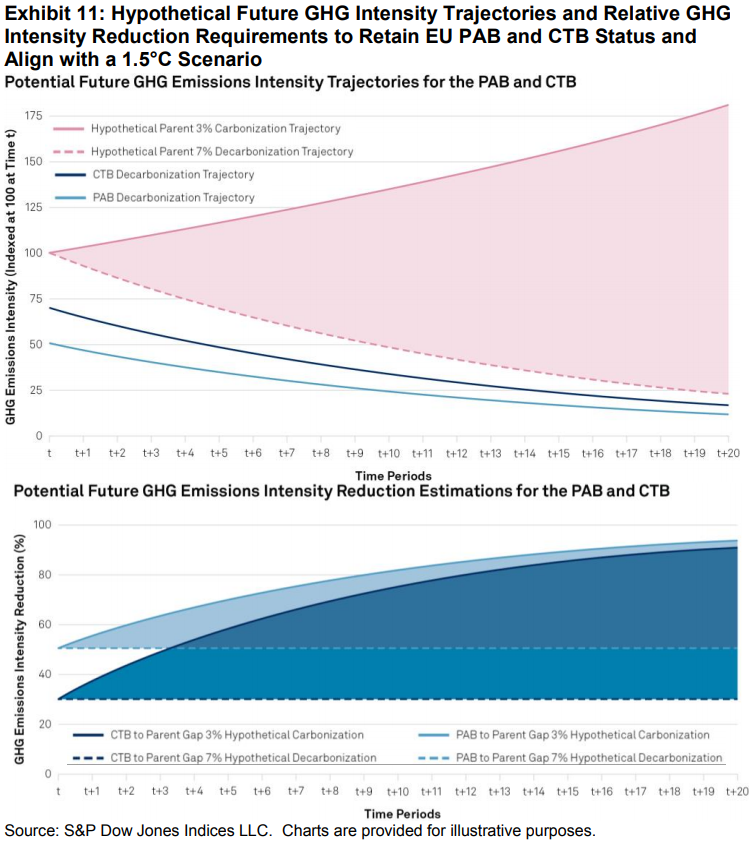
The future GHG emissions intensity trajectory of the underlying benchmark is unknown. However, we have high confidence that an absolute reduction in GHG emissions is required to limit global warming to within 1.5°C since pre-industrial levels. As such, the 7% year-on-year decarbonization target required by the EU CTB and PAB labels means the future required decarbonization relative to the underlying benchmark is unknown, since we do not know how quickly the benchmark would decarbonize (if at all). If the underlying benchmark decarbonizes at a rate of less than 7% year-on-year, then the implied decarbonization relative to the underlying index (bottom panel) will grow exponentially. Using an optimization to minimize active share helps reduce the possibility of high tracking error between the index and its underlying benchmark, and may be particularly useful if the overall market fails to decarbonize at a sufficient rate over time. Furthermore, strategies that target a specific level of tracking error or active share may find their methodology does not facilitate a solvable solution if the required decarbonization increases.
The methodology first excludes ineligible constituents from the underlying benchmark universe (see Exhibit 8). Then, based on the eligible constituents that remain, the methodology assigns weights by optimizing to minimize the differences in weights to the underlying index, while achieving all the climate objectives (see Exhibit 12).

On April 20, 2020, the first S&P PACT Indices were launched—including the S&P Eurozone LargeMidCap PA Index and S&P Eurozone LargeMidCap CT Index. The following sections explore the climate impacts and performance of the first indices from the series.
Exhibit 13 illustrates the GHG emissions intensity of the S&P Eurozone LargeMidCap and the S&P Eurozone LargeMidCap PA Index, against the decarbonization trajectory as proposed by the EU’s minimum standards for PABs.
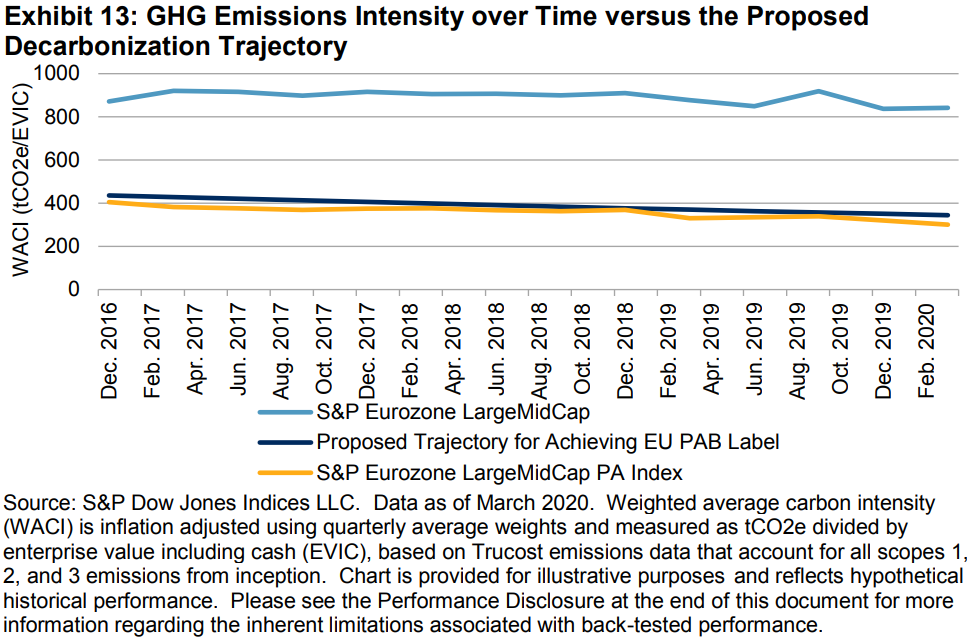
As Exhibit 13 shows, the S&P PA Indices Methodology satisfied both criteria of: (1) a 50% lower GHG emissions intensity than the underlying benchmark and (2) a 7% year-on-year self-decarbonization trajectory.
The first quarter of 2020 proved a stern test for the S&P PACT Indices Methodology, due to high levels of market volatility, causing falling EVIC, the denominator used for calculating the GHG emissions intensity. Over this period, the EVIC fell by 14%. Controlling for fluctuating EVIC minimizes market impact on the 7% year-on-year self-decarbonization, allowing company emissions to drive the decarbonization, rather than EVIC itself. Thus, despite the volatility over this period, this approach enabled the S&P Eurozone LargeMidCap PA Index to satisfy both criteria.
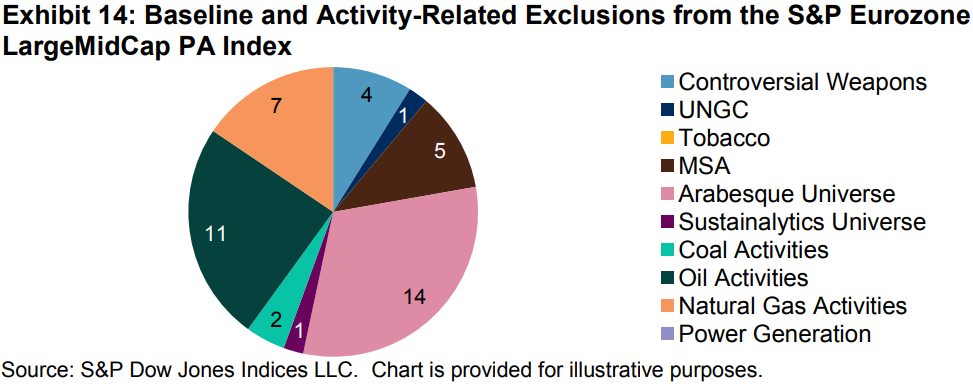
As of the index launch in April 2020, 173 of the 254 constituents of the S&P Eurozone LargeMidCap were included in the S&P Eurozone LargeMidCap PA Index. Of these 173 constituents, 39 were ineligible due to the exclusion criteria. Exhibit 14 highlights the rationale for each of these exclusions. The remaining 43 companies were not selected due to their inability to align with the various climate goals of the index, which means their optimized weights would not meet the required 1 basis point threshold.
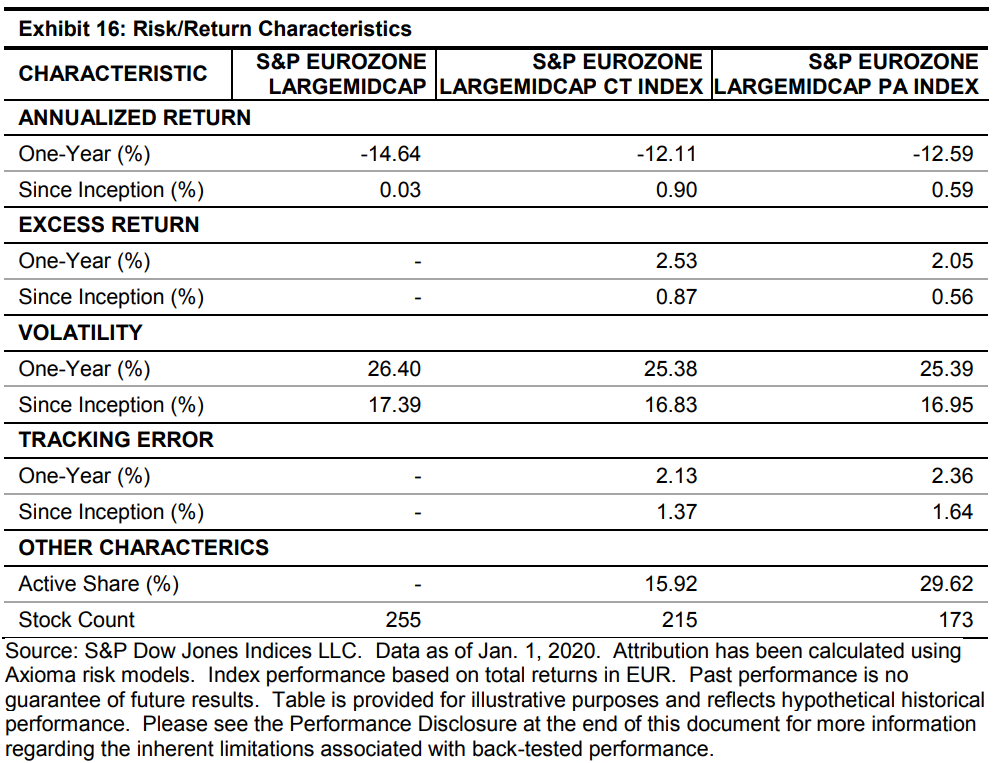
The S&P PACT Indices are designed to track the underlying benchmark as closely as possible, while simultaneously satisfying all constraints outlined in Exhibit 12. For the S&P Eurozone LargeMidCap PA Index, the strategy exhibited 1.64% of tracking error with excess returns of 2.05% compared with the underlying benchmark over the past year (see Exhibits 15 and 16).
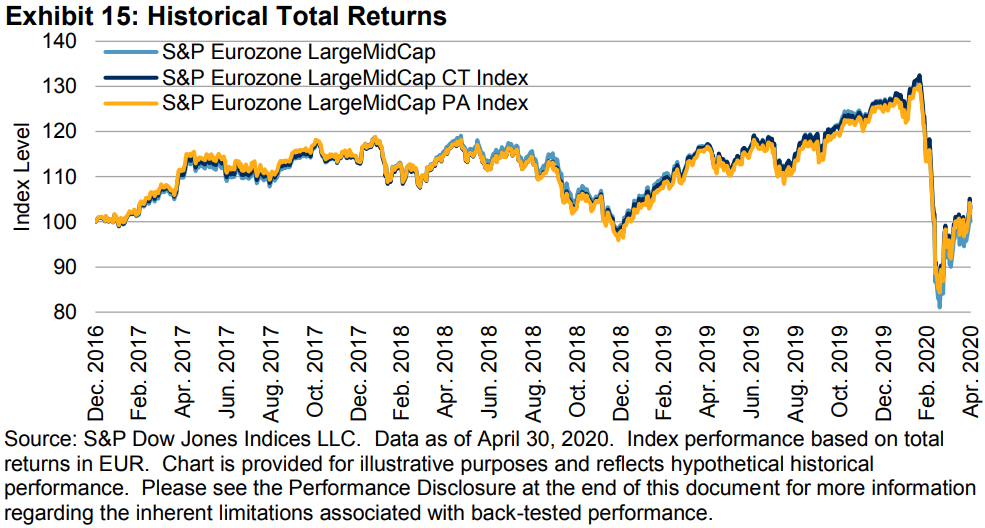
Both of the S&P PACT Indices outperformed the S&P Eurozone LargeMidCap over the past one-year period and since inception (see Exhibit 16). Risk-based active return attribution showed 85% of the S&P Eurozone LargeMidCap PA Index’s outperformance may be explained by a specific effect—that is, returns that cannot be explained by risk model factors. This unexplained alpha could be explained by a compensated risk premium associated with the S&P PACT Indices’ Methodology, other factors not incorporated in the risk model used, or other sources. A similar story was true of the S&P Eurozone LargeMidCap CT Index, although a higher percentage of active returns can be explained by the risk factors.
The potentially disastrous impacts associated with rising global temperatures underscore the importance of climate action. Investors and other market participants therefore have a critical role to play when it comes to financing a low-carbon transition. Regardless, the perils of climate change represent financially material risks for investor portfolios that need to be managed. To that end, the S&P PACT Indices supply the market with sustainable versions of S&P DJI benchmarks that are designed to align investments with a 1.5°C scenario and achieve net-zero emissions by 2050. The indices draw upon S&P Global’s market-leading environmental data and models to not only meet but exceed new technical standards proposed by the EU for Paris-Aligned and Climate-Transition Benchmarks, as well as TCFD recommendations—by accounting for the physical risks, transition risks, and financial opportunities arising from climate change. Numerous climate objectives are simultaneously incorporated while minimizing deviations from the underlying benchmark, resulting in broad, diversified exposure. The S&P PACT Indices thus provide a formidable new investor toolkit for adhering to our collective “pact” of transitioning to a 1.5°C world.

