Since the release of the Intergovernmental Panel on Climate Change (IPCC) report[1] in October 2018, there has been growing investor interest in 1.5οC scenario-aligned portfolios. In May 2018, the EU announced its action plan for sustainable finance, which included proposals to create two new carbon transition benchmarks (EU Climate Transition [CTB] and Paris-aligned Benchmarks [PAB]). The EU appointed a technical expert group (TEG) to report on the minimum standards for new benchmarks. On Sept. 30, 2019,[2] the TEG released its final report on benchmarks and benchmark ESG disclosures. The report provides information regarding the preparation of the delegated acts by the European Commission, which will be published in draft form before the end of the year. What is the likely effect of the TEG’s proposals on indices?
Consistent tracking error over time is commonplace for ESG indices, due to their design. However, new EU proposals on climate benchmarks[2] make the CTB and PAB active risk dependent on the parent index’s ability to meet their 7% year-on-year decarbonization trajectory (which is the linear decarbonization required for a 1.5οC scenario), due to absolute carbon intensity reductions rather than relative.[3] Therefore, tracking error will be driven by the parent index, which is outside of the control of CTB or PAB. This is not good or bad, in essence, but is a new paradigm for investors if they want to invest in CTB- or PAB-aligned products.
Exhibit 1 shows future PAB and CTB trajectories, as well as a range of possible trajectories from 7% decarbonization and 3% carbonization of the index (the first chart). Here it can be seen how much market trajectory divergence from a 1.5οC scenario could affect the index’s future Weighted Average Carbon Intensity (WACI). The second chart in Exhibit 1 shows the potential future carbon intensity reduction required to align with the TEG’s proposals for the CTB and PAB.
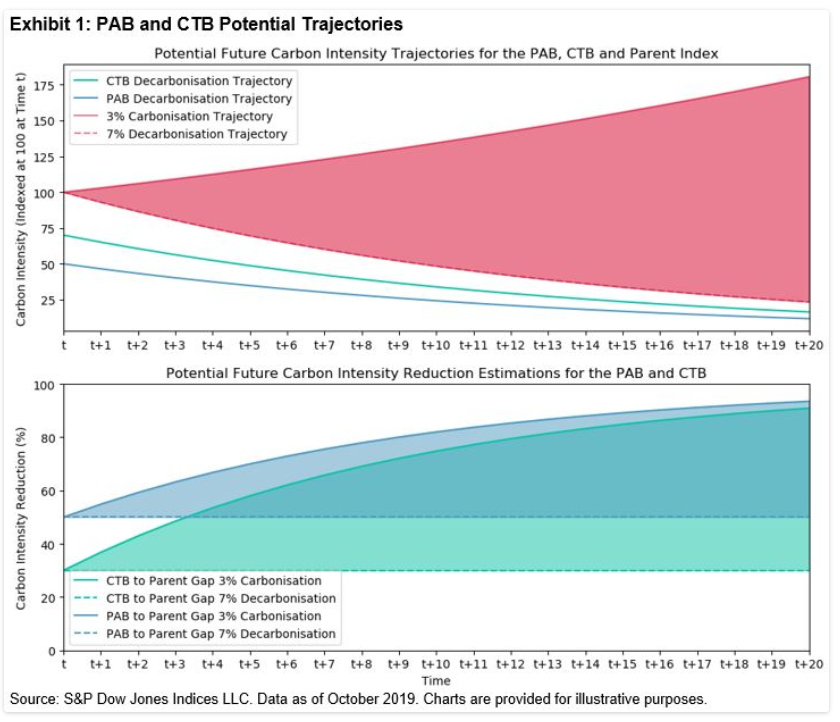
If the parent index decarbonizes at 7%, the level proposed in the TEG report, both the CTB and PAB would keep their initial level of percentage reduction, at 30% and 50%, respectively. However, if the parent index does not decarbonize at such a rate, the carbon intensity reduction would increase over time.
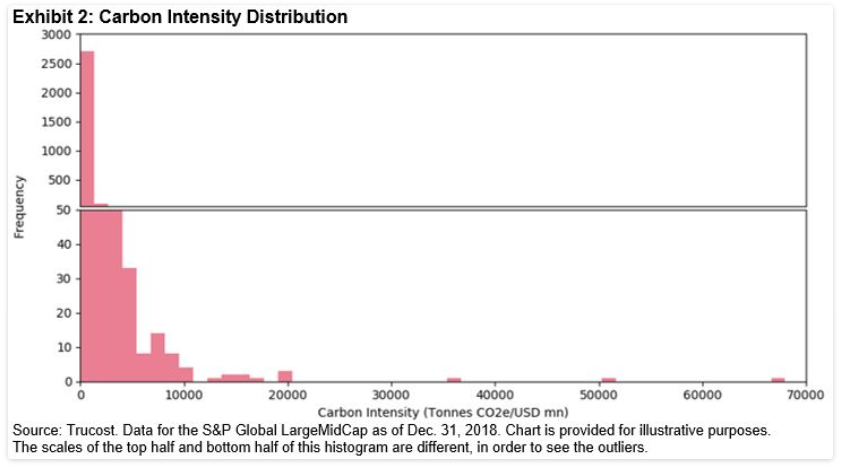
Due to the high skew of 17 for companies’ carbon intensity, (see Exhibit 2) the carbon intensity reduction and resulting active share of the CTB and PAB do not have a linear relationship. Achieving the initial 30% or 50% reduction does not require a large active share, as heavily underweighting or excluding the most carbon intensive companies would drastically reduce the WACI. However, active share would increase exponentially as carbon intensity reduction requirements rise and other constraints are incorporated.
These carbon intensity reductions are the absolute minimum needed to meet the TEGs proposals for CTBs or PABs. Therefore, reduction targets will likely have to be larger than the required reduction to ensure the PAB and CTB have sufficient leeway when weight drift affects the index’s WACI.[4]
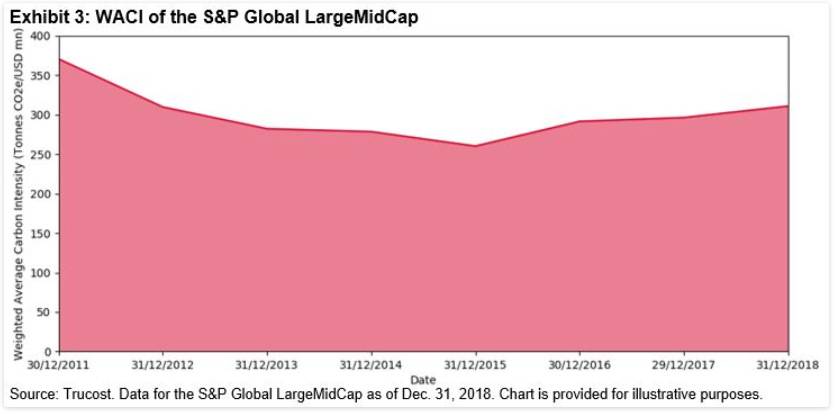
In recent years, the S&P Global LargeMidCap’s WACI has trended downward (see Exhibit 3), however, there have been fluctuations.[5] Due to the high concentration in carbon intensity in a few companies, their performance, and therefore weight in market-cap-weighted indices, is a large driver of an index’s WACI. Therefore, if the most carbon-intensive companies outperform, the WACI will increase significantly.
Overall, there are various carbon intensity trajectories market-cap-weighted indices can take, which would affect the level of active share required of indices to meet the TEG’s propsals for CTBs and PABs. As the proposed requirements of carbon reduction from the parent index increase, the active risk taken could rise expotentially due to the high positive skew in the distribution of corporates carbon intensity. This absolute emission target, as opposed to a relative emission reduction, is a new paradigm for index design.
[1] IPCC, 2018: Global warming of 1.5°C. An IPCC Special Report on the impacts of global warming of 1.5°C above pre-industrial levels and related global greenhouse gas emissions pathways, in the context of strengthening the global response to the threat of climate change, sustainable development, and efforts to eradicate poverty [V. Masson-Delmotte, P. Zhai, H. O. Pörtner, D. Roberts, J. Skea, P.R. Shukla, A. Pirani, W. Moufouma-Okia, C. Péan, R. Pidcock, S. Connors, J. B. R. Matthews, Y. Chen, X. Zhou, M. I. Gomis, E. Lonnoy, T. Maycock, M. Tignor, T. Waterfield (eds.)]. In Press.
[2] The EU Technical Expert Group on Sustainable Finance. (2019). TEG Final Report on Climate Benchmarks and Benchmarks’ ESG Disclosures. https://ec.europa.eu/info/sites/info/files/business_economy_euro/banking_and_finance/documents/190930-sustainable-finance-teg-final-report-climate-benchmarks-and-disclosures_en.pdf.
[3] The current norm for indices is to seek a relative change from the benchmark. However, under the proposals of the TEG, the index provider shall set their 30 % (for the CTB) and 50% (for the PAB) reduction anchor, then set the trajectory line for the decarbonization of the CTB and PAB. As a result, the CTB and PAB make an absolute level of reduction, rather than a relative one.
[4] The WACI has to be calculated using average weights over the period, according to the TEG’s proposals.
[5] The S&P Global LargeMidCap’s carbon intensity has not been adjusted for inflation as the proposed in the TEG’s report. Therefore, when adjusted for inflation, the slope would have less of a negative trajectory.
