Discover more about S&P Global’s offerings
Published: October 16, 2019
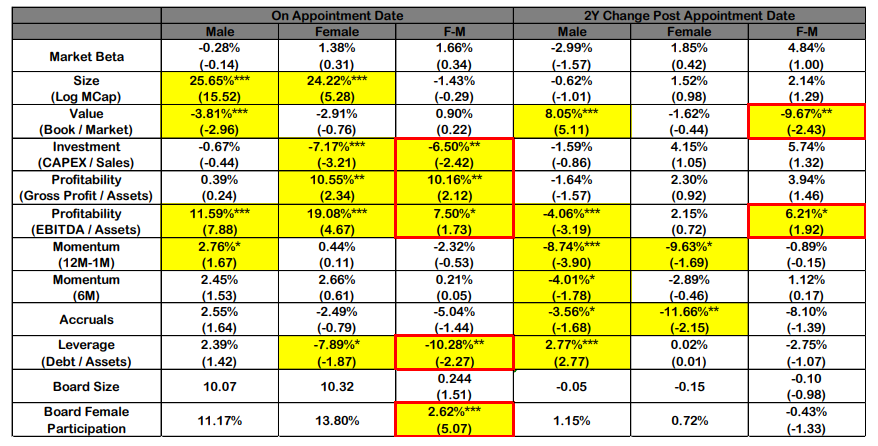
The study finds that firms with female CFOs are more profitable and generated excess profits2 of $1.8T over the study horizon.
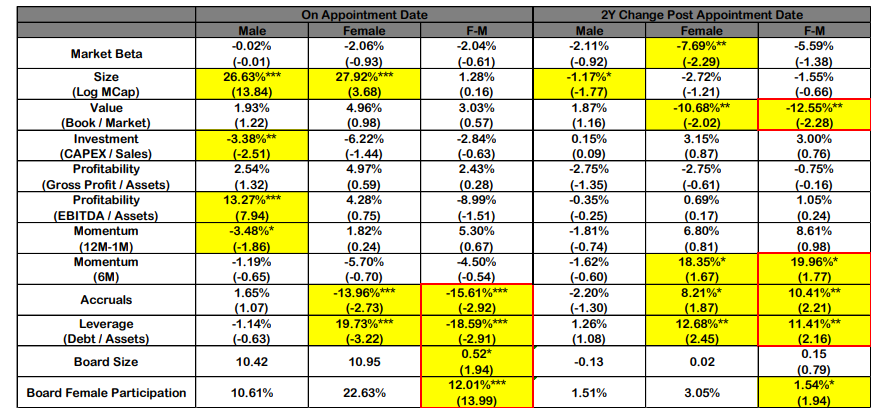
Firms with female CEOs and CFOs have produced superior stock price performance, compared to the market average. In the 24 months post-appointment, female CEOs saw a 20% increase in stock price momentum and female CFOs saw a 6% increase in profitability and 8% larger stock returns. These results are economically and statistically significant.
Firms with a high gender diversity on their board of directors were more profitable and larger than firms with low gender diversity. Firms with female CEOs and CFOs have a demonstrated culture of Diversity and Inclusion (D&I), evinced by a larger representation of females on the company’s board of directors. Firms with female CEOs have twice the number of female board members, compared to the market average (23% vs 11%).
Analysis of executive biographies suggests that one driver of superior results by females may be that females are held to a higher standard. The average female executive has characteristics in common with the most successful male executives, suggesting that common attributes drive success among males and females, alike. Overall, the attributes that correlate with success among male executives were found more often in female executives. This finding refutes the commonly held belief in ‘token’ female executives.
For a PDF of this report, please download.
The New York Times noted that “fewer large companies are run by women than by men named John”, in an article1 published in 2015. “The Johns” were in second place by year-end 2016, but not by much (Figure 1). Although female executives remain grossly underrepresented in the C-suite, this small victory for gender inclusion underscores a changing dynamic. Did this change pay?
Figure 1. Female Participation Rate for Chief Executive Officer Positions. Relative percentage of companies in the Russell 3000 Index by gender. Males are subdivided by those named John versus not named John. Source: S&P Global Market Intelligence Quantamental Research. Data as of June 6, 2019.
In 1986, Carol Hymowitz and Timothy Schelhardt coined the term ‘Glass Ceiling’ as a metaphor for the forces or circumstances which prevent female professionals from reaching senior management positions. In the thirty-three years since, the topic of gender5 bias has received gradually increasing attention. Despite this focus, the female participation rate in senior management positions remains far from parity today. As of year-end 2018, there are approximately 19 male CEOs for every 1 female CEO and 6.5 male CFOs for every 1 female CFO, among companies within the Russell 3000 Index. The underrepresentation of females in key executive positions has raised a number of questions and inspired empirical research aimed at finding answers.
Unfortunately, the paucity of data (i.e. the limited number of female executives and the limited availability of structured, historical data6 relevant to this topic) has limited the scope of previous research until recently. Early undertakings attempted to extract insights by evaluating as few as 25 diverse firms (Adler 2000) or considering a single date cross-section in the analysis (Carter, Simkins, Simpson 2002). More recent work has extended the time horizon (Hunt, Layton, Prince 2015) or made use of a market-representative index such as the S&P 1500 (Wolfers 2006), with caveats around data limitations.
The analyses herein will evaluate the Russell 3000 universe over a 17-year period (December 31, 2002 through May 31, 2019); including 5,825 new executive appointments, of which 578 were female; making this study one of the most comprehensive contributions to the topic of gender inequality in the office of the CEO and CFO. Despite the size of this study, we admonish the reader to interpret the results as a descriptive analysis, relevant from a governance standpoint, but not providing evidence of a predictive trading signal.
A modified event-study (MacKinlay 1997) approach is used throughout this paper and detailed in section 4. The “event” of consideration is the beginning of the tenure of a new executive in the CEO role (table 1, figure 2 left) or, in a separate analysis, to the CFO role (table 2, figure 2 right). The collection of events in which the new appointee is female (male) is termed the female (male) contingent. The tables summarize the characteristics7,8 for firms on, and after, the appointment of a new executive. Averages are separately reported for the female and male contingents, as well as for the difference between the two contingents.
The female contingent was associated with a greater value appreciation, defined as a declining book to market ratio, in the 24-month period after a female CEO or CFO took office. Comparatively, the male contingent was statistically indistinguishable from its sector peer group. Weak statistical evidence supports that this value appreciation was associated with an increase in intermediate term price momentum for female CEO appointments. Consistent with results reported by Peltomäki and co-workers (Peltomäki, Swidler, Vähämaa 2018), firms which appointed a female CFO also had higher profitability. In the framework presented herein, we corroborate those results and also show the female contingent maintained profitability (average 2-year change was indistinguishable from 0) whereas the male CFO contingent saw a profitability erosion. These observations are consistent with greater average skill among the female contingent than the male contingent.
The data also support cultural differences between firms in the two contingents, similar to previous literature. However, our framework leads to a different interpretation than previous work. For example, Krishnan and Parsons (2008) attribute the correlation between firms with high gender diversity and high earnings quality9 to the ways “women differ in their approach to money and investing”. We find that, while firms that appointed a female CEO had above average earnings quality (below average accruals) at the time the executive took office, accruals reverted to the mean (increased) in the 24-month period thereafter. Similarly, Peltomäki and co-workers (2018) explored the premise that “women try to avoid losses and are more cautious”,10 showing that firms with female CFOs employ lower financial leverage11 than their male counterparts as support. Again, our analyses find similar results with statistically lower financial leverage for the female contingent of both CEO and CFO positions when the executive takes office. However, the female contingent firms increased leverage in the 24 months following the CEO’s start date and maintained leverage in the 24 months following the CFO’s start date. Therefore, the causal relationship is questionable and possibly reversed. In other words, our analysis supports that firms with higher earnings quality and lower leverage are firms with a culture conducive to making a female appointment, rather than the premise that stereotypical differences in the actions of the female executives, after their appointment, drive these differences.
Firms that appointed a female CEO or CFO had a higher female participation rate on their board of directors compared to firms that made male appointments. Empirical evidence supports a growth in the female participation rate of the board over the first 24 months following the appointment of a female CEO. These observations further support the idea that diversity and inclusion are features that gradually infuse into the culture of a firm.

*** = Significant at the 1% level; ** = Significant at the 5% level; * = Significant at the 10% level For each value in the table except Board Size and Board Female Participation, an average Z-score is reported with corresponding test statistic in parentheses. Z-scores are presented as a percent of one standard deviation.

*** = Significant at the 1% level; ** = Significant at the 5% level; * = Significant at the 10% Level For each value in the table except Board Size and Board Female Participation, an average Z-score is reported with corresponding test statistic in parentheses. Z-scores are presented as a percent of one standard deviation.
Source for Tables 1 and 2: S&P Global Market Intelligence Quantamental Research. Data as of June 6, 2019. Indices are unmanaged, statistical composites and their returns do not include payment of any sales charges or fees an investor would pay to purchase the securities they represent. Such costs would lower performance. It is not possible to invest directly in an index. Past performance is not a guarantee of future results.


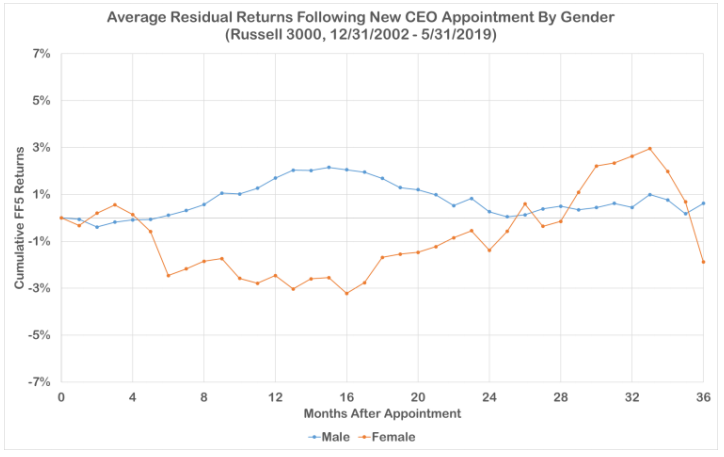
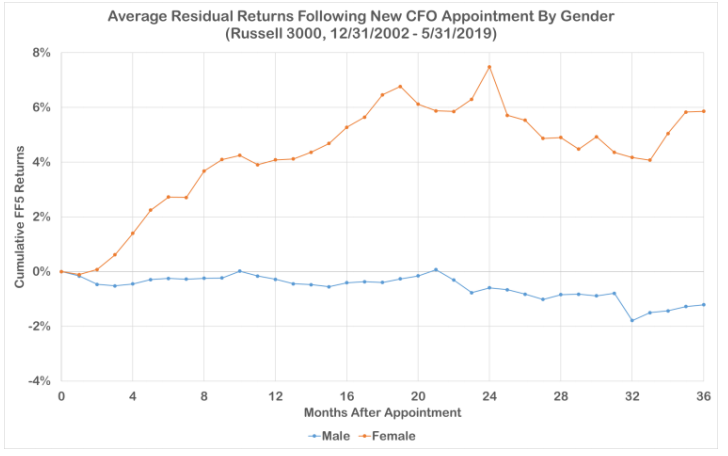
*** = Significant at the 1% level; ** = Significant at the 5% level; * = Significant at the 10% Level Figure 2. Fama-French 5 (FF5) Factor Adjusted Returns. The average FF5 residual return demeaned at the sector level is reported for the male and female contingent in the 36-months following appointment of a new CEO (left) and CFO (right).

*** = Significant at the 1% level; ** = Significant at the 5% level; * = Significant at the 10% Level Source for Figure 2 and Table 3: S&P Global Market Intelligence Quantamental Research. Data as of June 6, 2019. Indices are unmanaged, statistical composites and their returns do not include payment of any sales charges or fees an investor would pay to purchase the securities they represent. Such costs would lower performance. It is not possible to invest directly in an index. Past performance is not a guarantee of future results.
After adjusting for differences in firm characteristics (Fama, French 2015) and sector performance, we found the female contingent earned larger adjusted returns than the male contingent among the CFO position, but not the CEO position (Figure 2). For the CFO position, the test for the difference of two means indicated a maximum difference of greater than 8% between contingents, occurring at the 24-month time horizon and statistically significant at the 1% level. The male contingent of CFO appointments produced returns that were statistically indistinguishable from the sector average throughout the backtest, whereas the female contingent yielded an average premium.
Average returns to firms in the two contingents following the appointment of a new CEO were statistically indistinguishable from each other. The male contingent yielded a small positive premium with weak statistical significance at time horizons of 9-18 months, whereas the female contingent and the two-population difference failed to meet the test for statistical significance. A closer inspection of the standard errors for the contingents within the CEO appointments showed that our sample means would have had to differ by more than 7% (in either direction) to meet statistical significance at the 10% threshold, compared to a difference of just 5% for the position of CFO. The difference of means between contingents for the CEO position falls well below 7%. Note that the high threshold for significance is almost entirely attributable to the small sample size of only 143 female CEO appointments.
The prior hypothesis at the outset of this study was that talent is equally distributed across genders. In the previous section, we find evidence that female executives drive greater value appreciation, improve price momentum, better defend profitability moats, and earn excess returns over their male counterparts. Do these two assertions conflict?
We argue they do not. Rather, the board of directors may be holding female appointees to a higher standard than male appointees, such that the females in C-suite positions are consequently more talented. The high male-to-female ratio of executives in C-suite positions supports this premise. Being more selective with female appointees, means that the board of directors may pass over a more qualified female in favor of a less qualified male. If this is the case, it follows that the remaining pool of female contenders for C-suite positions remains richer with talent.
In support of the aforementioned premise, we show below the results of a natural language processing (NLP) analysis which demonstrates that the achievements, education, or personal traits associated with success occur more often within the female contingent. The features associated with success for the appointed executives in this study were extracted from those executives’ biographies, which are included in the S&P Capital IQ Professionals dataset. First, a dictionary was trained on the corpus excluding the female contingent (training set). The positivity of a particular word12 was determined by the relative occurrence of that word13 among companies that earned positive excess returns versus those that did not, inside of the training set. Separately, the relative occurrence of the same set of words in the female contingent (the test set) relative to the male contingent was evaluated. In regression plots (Figure 3), we found that the relative occurrence of language used to describe all the female executives, versus all male executives, was highly correlated with the language used to describe the successful male executives.
The implication of the positive correlation between the language used to describe all female executives and successful male executives is profound. Unlike some previous literature which attributes performance differences to gender-specific behaviors or aversions, our analysis supports common features favor success for males and females alike, and those features are more prevalent in the female contingent, to date. Our interpretation is that the male contingent is relatively ‘overfished’ compared to the female contingent, as a direct result of a bias preventing women from C-suite appointments (the so-called glass ceiling).14


Figure 3. Natural Language Processing of Executive Biographies. For each of the executives in our study, the executive’s biography was parsed by a Natural Language Processing procedure, which identifies the positivity and femininity of tokenized words. A positive and significant correlation was observed in regressions of femininity score on positivity score.
Source: S&P Global Market Intelligence Quantamental Research. Data as of June 6, 2019
Assuming our interpretation is correct, the regression coefficient should approach 0 as executive appointments reach gender parity. In other words, if C-suite appointments have historically been made on the basis of merit with a proviso on male gender, we posit that removing that proviso and allowing the system to equilibrate will show that male and female executives are equally equipped to drive their firms’ success.
The methodology and tools used in this research are reviewed in this section.
The S&P Capital IQ Professionals Dataset profiles professionals with current and prior board/company affiliations. Data include biographies, standardized job functions, titles, education, compensation, options holdings, and full committee memberships. This dataset covers 4.5 million professionals internationally, with robust coverage for the Russell 3000 starting in 2002. Company fundamental data were obtained from the Alpha Factor Library package, which provides hundreds of pre-calculated factors including financial ratios, valuation metrics, and price and momentum statistics. All factors are constructed using pointin-time data. Additional company fundamentals and pricing were obtained from the Capital IQ Financials Dataset, which contains point-in-time global coverage of key financial metrics and reported financials. In addition to content from the S&P Global Market Intelligence ecosystem, this study utilized free third-party data from the United States Social Security Administration (SSA).15 The SSA maintains a database of baby first names, baby sex, yearof-birth and total count for all newborns in the United States. These data were used, as described in section 4.2.
1. Included within the Professionals database is a field labeled ‘prefix’. When the prefix field was equal to ‘Mr.’, ‘Sir’, ‘Count’, ‘Father’, ‘Sheikh’, ‘Bishop’, ‘Lord’, ‘Hafiz’, ‘Baron’, or ‘Janab' then the executive was assumed to be male. When the prefix field was equal to ‘Mrs.’, ‘Miss’, ‘Ms.’, ‘Sister’, ‘Lady’, ‘Madam’, ‘Countess’, ‘Baroness’, or ‘First Lady’ then the executive was assumed to be female. For all other prefixes (such as ‘Dr.’, ‘Professor’, ‘Lieutenant’, etc.) the gender was assigned ‘ambiguous’ for this method.
2. The biographies of each executive were parsed for the presence of gender related pronouns (“he”, “him”, “his”, “she”, “her”, “hers”). If a minimum of 90% of the pronouns in the biography were specific to one gender, that gender was assumed for the executive; otherwise, the gender was assigned ‘ambiguous’ for this method.
3. Data from the U.S. Social Security Administration were used to calculate the gender certainty associated with a first name and year of birth. For example, in 1975, 99.3% of babies named ‘John’ were male. If the gender certainty of an executive’s first name in the year the executive was born was greater than 90%, then the executive’s gender was assigned as such; otherwise the gender was assigned ‘ambiguous’ for this method.
After the 3 steps were completed for each executive in the study, the gender assignments were programmatically compared for agreement, ignoring ambiguous results. Ambiguous records were resolved by a web search.
The constituents of the Russell 3000 were filtered to remove penny stocks and low-priced stocks, due to difficulty reliably determining the start date of the executives for many of these firms. Changes to the unique person identifier associated with the CEO or CFO position of the remaining firms triggered a potential event for analysis. To minimize the impact of interim executives on the results, a forward looking analysis was done for each potential event and if the executive was replaced within 24 months of starting the position then the event was removed from the analysis.
Prior to averaging, financial ratios were normalized by computing a sector-relative crosssectional Z-score by using equation 1,
 eqn. 1
where 𝑍𝑖 𝑚(𝑡) is the Z-scored value of the metric, 𝑚, for firm, 𝑖, at time, 𝑡; ⟨𝑚(𝑡)⟩𝑠𝑒𝑐𝑡𝑜𝑟 𝐶𝑆 represents the cross-sectional average value of metric, 𝑚, for all the firms in same sector (GICS level 1) as the focal firm, 𝑖, in the universe at time, 𝑡; and 𝜎𝑠𝑒𝑐𝑡𝑜𝑟 𝐶𝑆 𝑚(𝑡) is the standard deviation of the values used to calculate ⟨𝑚(𝑡)⟩𝑠𝑒𝑐𝑡𝑜𝑟 𝐶𝑆.
Changes to the companies’ metrics from the date the executive took office (𝑡 = 0) to a date 24-months after the executive took office (𝑡 = 24) were calculated by using equation 2,
![]() eqn. 2
eqn. 2
where ∆𝑍𝑖 𝑚 is the change in the Z-scored metric; 𝑍𝑖 𝑚(24) represents the Z-scored metric 24 months after the executive’s start date; and 𝑍𝑖 𝑚(0) represents the Z-scored metric on the executive’s start date.
The biography of each newly appointed executive in this study formed the corpus for a natural language processing (NLP) analysis. The dictionary for the analysis was defined as the set of unique tokens generated by parsing, tokenizing, and stemming (Paice 1990) all words in the corpus. The following tokens were removed from the dictionary16: 1) stop words, as defined by Python’s NLTK module (Bird, Loper, Klein 2009), 2) words that were unique to one of the contingents of the corpus, such as ‘chairwoman’, and 3) numerical tokens such as years and dates. The final dictionary contained approximately 3,000 unique tokens.
The male contingent of the corpus was used as training data to assign a positivity score to each token in the dictionary. First, the contingent was subdivided into an outperform subset, containing firms with positive risk-adjusted returns (as were used in Figure 2), and an underperform subset. The positivity score was calculated by using equation 3,
 eqn. 3
where 𝑃𝑜𝑠𝑖 is the positivity score of token 𝑖; 𝑁𝑖 𝑂𝑢𝑡𝑝𝑒𝑟𝑓𝑜𝑟𝑚 (𝑁𝑖 𝑈𝑛𝑑𝑒𝑟𝑝𝑒𝑟𝑓𝑜𝑟𝑚) is the number of biographies in the outperform (underperform) subset that contain token 𝑖; and 𝑁 𝑂𝑢𝑡𝑝𝑒𝑟𝑓𝑜𝑟𝑚 (𝑁 𝑈𝑛𝑑𝑒𝑟𝑝𝑒𝑟𝑓𝑜𝑟𝑚) is the total number of biographies in the outperform (underperform) subset.
Using the full corpus (male and female contingents), a femininity score was assigned to each token in the dictionary, by using equation 4,
 eqn. 4
where 𝐹𝑒𝑚𝑗 is the femininity score of token 𝑗; 𝑀𝑗 𝐹𝑒𝑚𝑎𝑙𝑒 (𝑀𝑗 𝑀𝑎𝑙𝑒) is the number of biographies in the female (male) contingent that contain token 𝑗; and 𝑀𝐹𝑒𝑚𝑎𝑙𝑒 (𝑀𝑀𝑎𝑙𝑒) is the total number of biographies in the female (male) contingent.
In one of the largest studies on gender in the C-suite, to date, evidence of underrepresentation and outperformance among female executives relative to their male peers has been presented. Specifically, over the time-horizon of the study, female CEOs saw more value appreciation and improved stock price momentum for their firms; whereas female CFOs drove more value appreciation, better defended profitability moats, and delivered excess riskadjusted returns for their firms. We proposed that the observed outperformance was a result of above-average talent among female executives. The female contenders for C-suite positions represent a relatively underutilized pool of talent, possibly attributable to a higher degree of scrutiny from the firms’ board of directors and consequently resulting in the tendency of females in C-suite positions to be more talented. As support for the premise, a natural language processing (NLP) technique was applied to the biographies of executives and the conclusion that female executives more frequently possessed the attributes associated with success among their male counterparts was demonstrated. If our premise is correct, the differences cited should dissipate when females are equally represented in C-suite positions. In other words, talent is equally distributed and until executives are selected on the basis of talent without other biases, we expect change pays.
