Markets expect elevated volatility surrounding the U.S. Presidential election, now just six weeks away. The VIX futures curve currently peaks in November, but as long ago as April a close observer could detect expectations of electoral volatility. Increased volatility may create an unusual opportunity for sector allocators.
To understand why, we need to remember that volatility is directly connected to dispersion, which measures the spread among the returns of an index’s components. When volatility goes up, dispersion tends to rise as well, as the gap between winners and losers widens; we saw a spectacular example of this in the first quarter of 2020. The greater the spread, the greater the opportunity to add (or subtract) value.
Dispersion can be measured at various levels of granularity—for example among stocks or sectors in the S&P 500®, as illustrated in Exhibit 1. Obviously, the spread among the returns of 500 stocks will be greater than the spread among the returns of 11 sectors. (The larger spread is partially offset by the superior capacity of sector-based funds.)
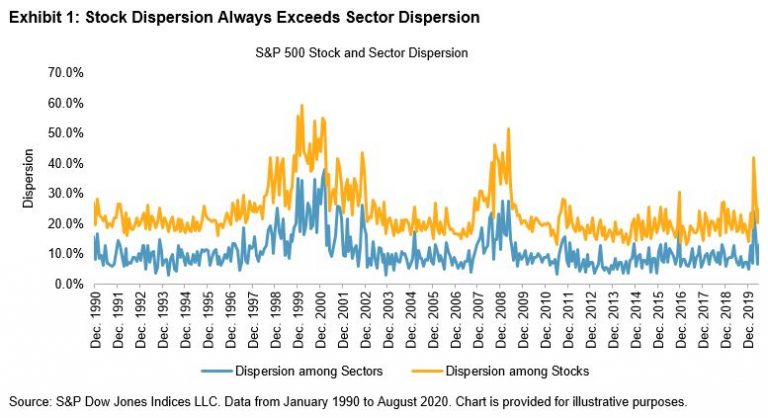
The total dispersion of the S&P 500 (at the stock level) can be decomposed into the average dispersion within each sector and the dispersion across sectors. The nature of the relationship will be familiar to anyone who remembers high school geometry: the square of total dispersion is approximately equal to the sum of the squares of within-sector and cross-sector dispersion.
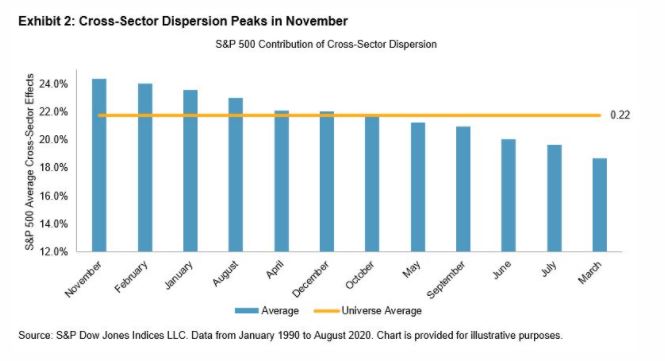
Over time, cross-sector dispersion has accounted for approximately 22% of the market’s total dispersion. But the overall average masks substantial calendar variation. As Exhibit 2 shows, the importance of sector dispersion peaks in November and is relatively low in March.
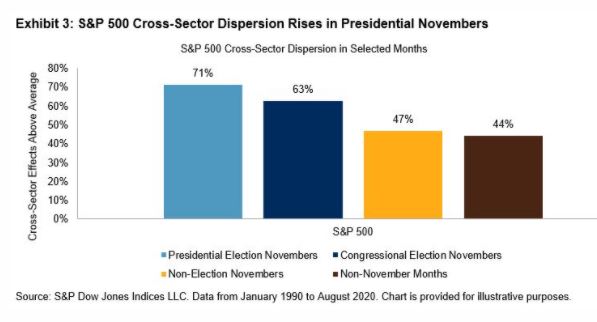
And as it turns out, some Novembers are more significant than others. Specifically, in 71% of the Novembers when U.S. Presidential elections took place, the importance of cross-sector dispersion in the S&P 500 was greater than average, as shown in Exhibit 3. In off-year elections (with only Congressional and Senate seats at stake, but not the White House), sectoral importance also rises, although not to the level of Novembers with a Presidential contest.
Dispersion, it’s important to remember, is a double-edged sword. Higher dispersion raises the stakes for active managers, in both directions: if dispersion is high, correct stock or sector picks will pay off more, and incorrect picks will underperform by more. History tells us that the contribution of sectors to total dispersion is likely to rise in the next six weeks, which means that the importance of skillful sector picks will increase. For investors with a genuine ability to rotate across sectors tactically, November could be a month of unusual opportunity.
The posts on this blog are opinions, not advice. Please read our Disclaimers.