Sep. 30 2019 — Corporate leverage is worsening in 2019 as debt rises faster than earnings for nonfinancial companies. S&P Global Ratings believes faltering profit growth threatens an earnings recession. This in turn may be a leading indicator of an economic recession. Indeed, after evaluating a variety of factors, our economics team recently raised the risk of a U.S. recession in the next 12 months to 30%-35%.
Weak earnings threaten to drive up corporate leverage. Chart 1-1 indicates that debt and earnings rose in tandem between 2011 and 2017 for a global sample pool of 20,071 nonfinancial corporates (largely unrated). But the trend diverged in first fiscal-half 2019: debt growth jumped while that of earnings fell. Similarly, for our rated portfolio, we project debt will expand faster than earnings in 2019 (see chart 1-2).
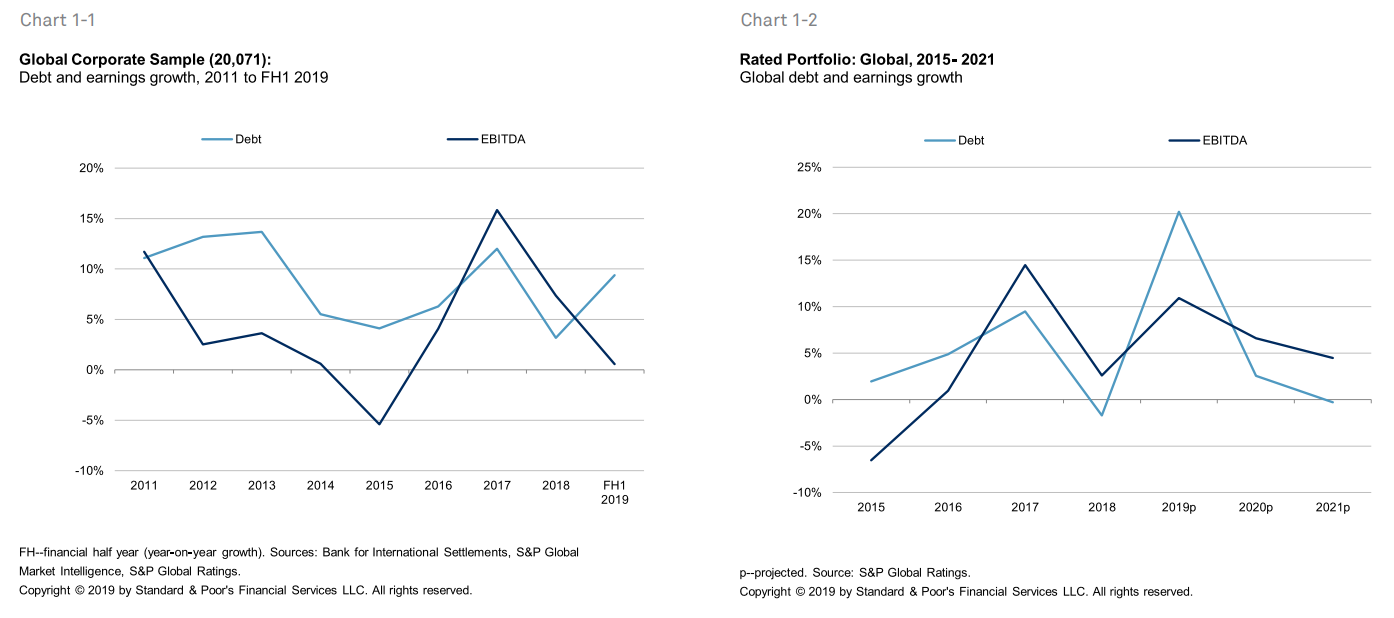
Debt rise. Could the higher debt growth in early 2019 be an anomaly? The trend could have been driven by two market developments. First, borrowers returned to market after having been sidelined by a partial shutdown in the U.S. noninvestment grade corporate bond market in the fourth quarter of 2018. Second, lenders and investors perceived signals from the U.S. Federal Reserve in the first quarter 2019 as indicating a "lower for longer" environment. Taken together, we have willing borrowers and willing lenders.
Early warning indicators. We chose a large sample size (20,071 companies) to capture medium-sized enterprises in the study. Such enterprises are more likely than their established larger counterparts to serve as the "canary in the coal mine". Indeed, 85% of the sample (based on borrower count and debt amount) is unrated by S&P Global Ratings (henceforth "the unrated sample"). We believe the default rates are likely to be higher in the unrated sample than in the rated portfolio. The sample's gross debt of US$30 trillion is equivalent to a substantial two-fifths of the estimated total global nonfinancial corporate debt of US$73 trillion.
Rated portfolio. As previously alluded, rated corporates tend to be larger than most of those in the unrated sample. This advantage allows rated companies to borrow more relative to size yet enjoy more robust profit margins. Indeed, we project earnings growth of the rated portfolio will improve in 2019 over 2018 (while earnings growth of the unrated sample is declining). However, debt growth of the rated portfolio will also exceed that of earnings (see chart 1-2). More positively, we expect the debt growth rate to moderate to below that of earnings in 2020 and 2021.
Geographies. In the unrated sample, the Asia-Pacific region (chart 2-1) is the primary driver for weaker global earnings growth. We see this phenomenon as tied to China's economic slowdown. Europe (chart 3-1) and Latin America (chart 4-1) are largely flat while North America (chart 5-1) has gone off its recent peak. (Charts for the 10 largest countries or economies by GDP are provided in Appendix 2).
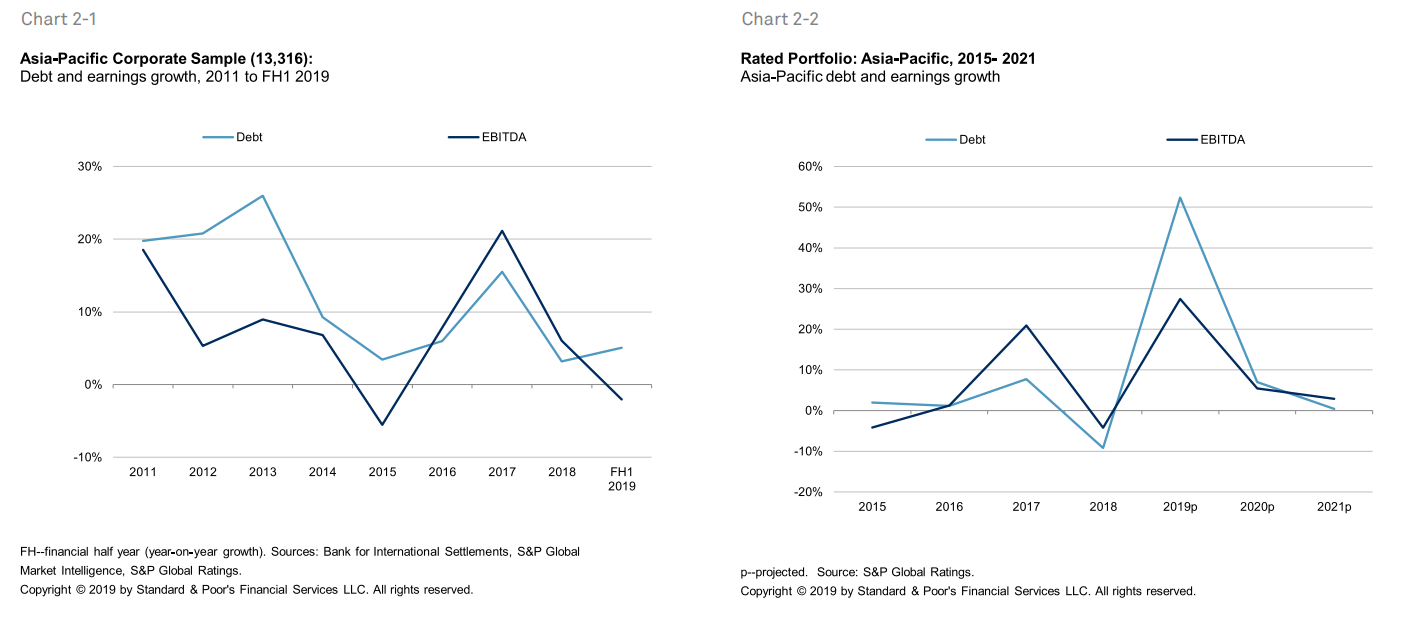
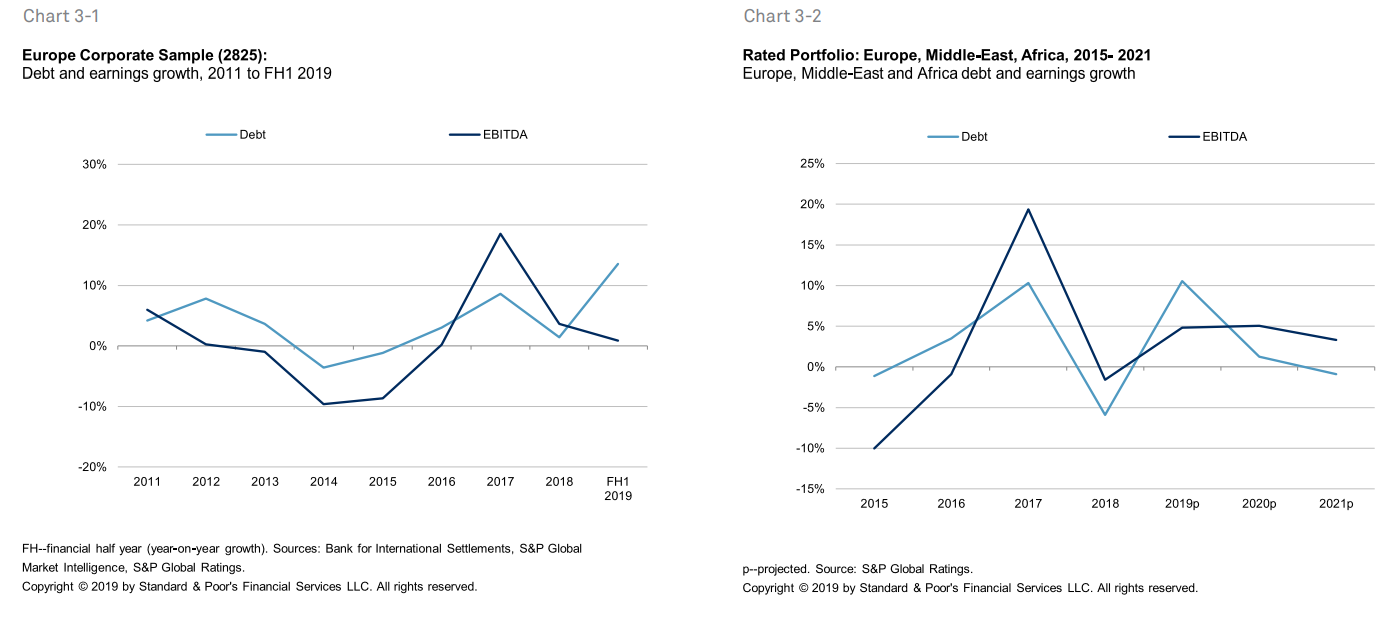
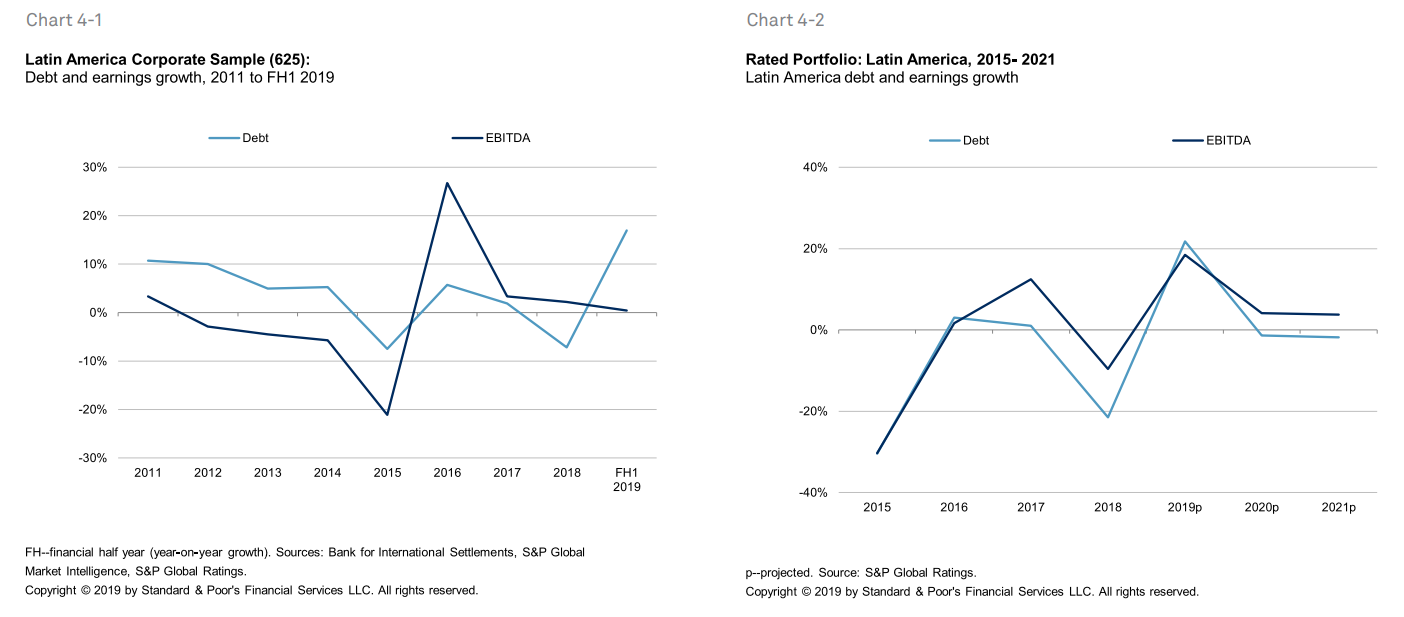
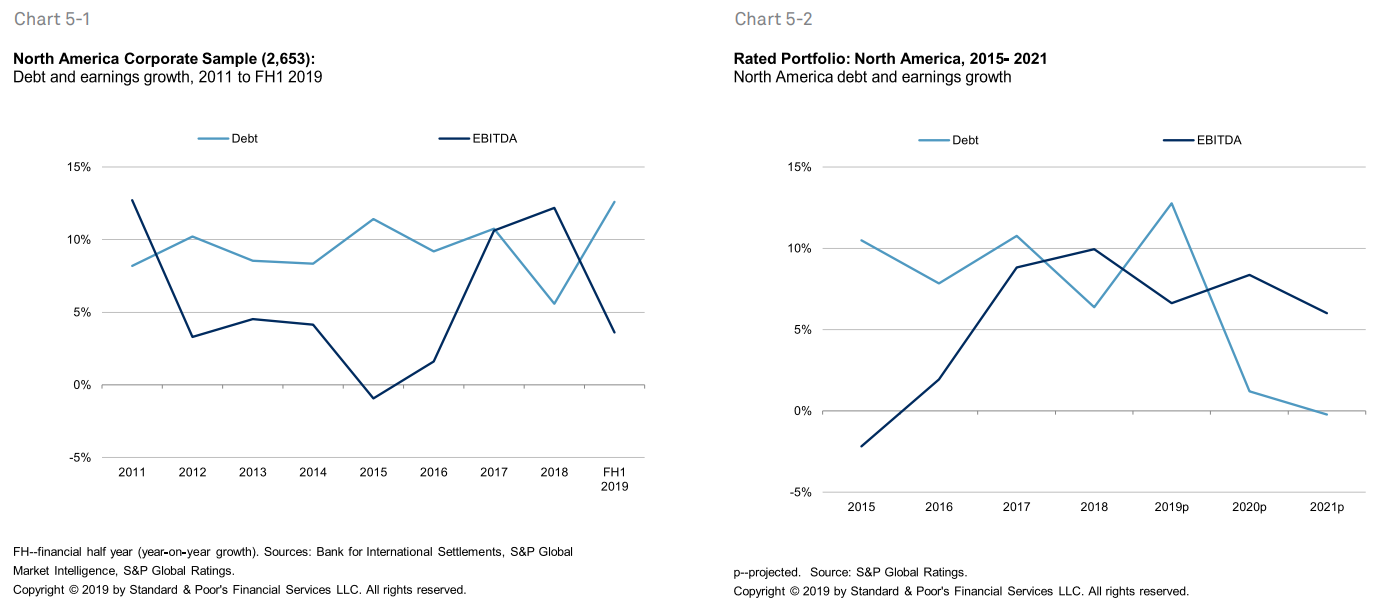
For the rated portfolio, charts 2-2 to 5-2 show historical trends and our projections by geographic region. For Asia-Pacific (chart 2-2); Europe, Middle-East and Africa (chart 3-2); and Latin America (chart 4-2), we expect earnings to grow slightly ahead of debt over the next two years. For North America, the debt build-up from recent mergers and acquisitions (M&A) activity is expected to wind down (chart 5-2), translating to improved leverage. Our projections are base case. In a downside recessionary scenario, compressed earnings could reverse leverage improvements.
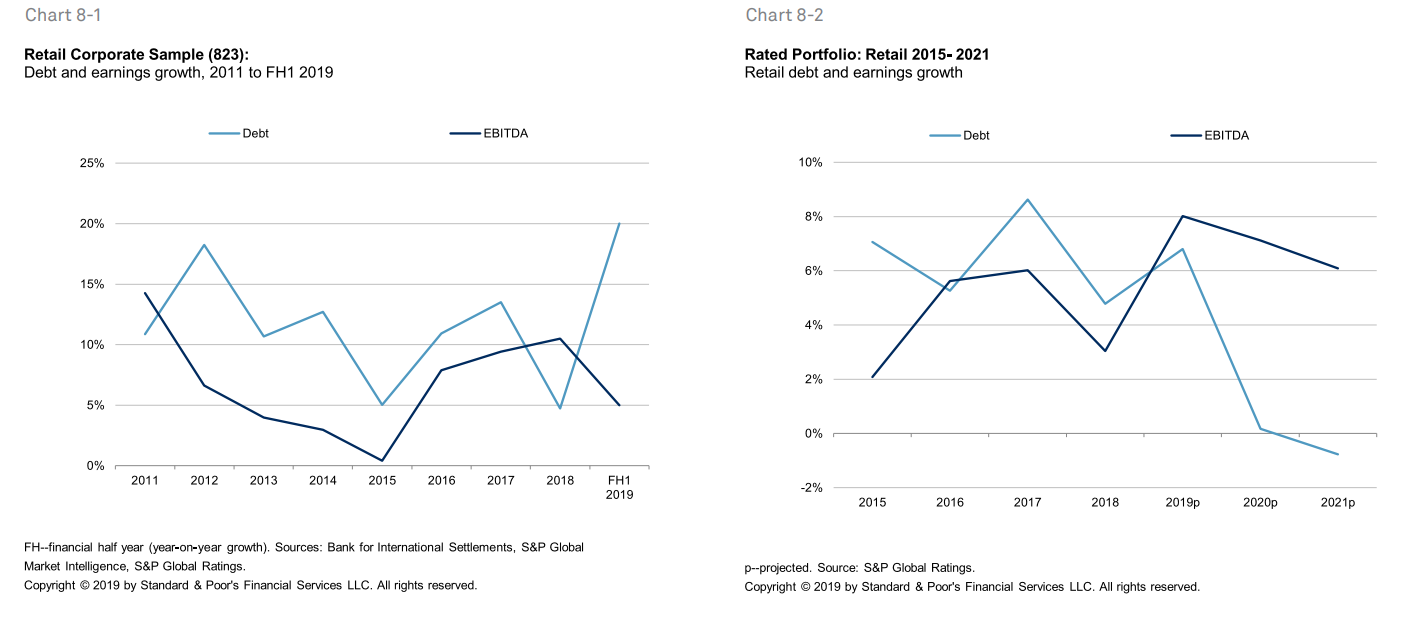
Sectors at risk. Charts 6-1 to 8-1 show three industry sectors which face heightened credit risks. These are auto (chart 6-1 for the unrated sample and chart 6-2 for the rated portfolio), consumer products (charts 7-1 and 7-2), and retail (charts 8-1 and 8-2).
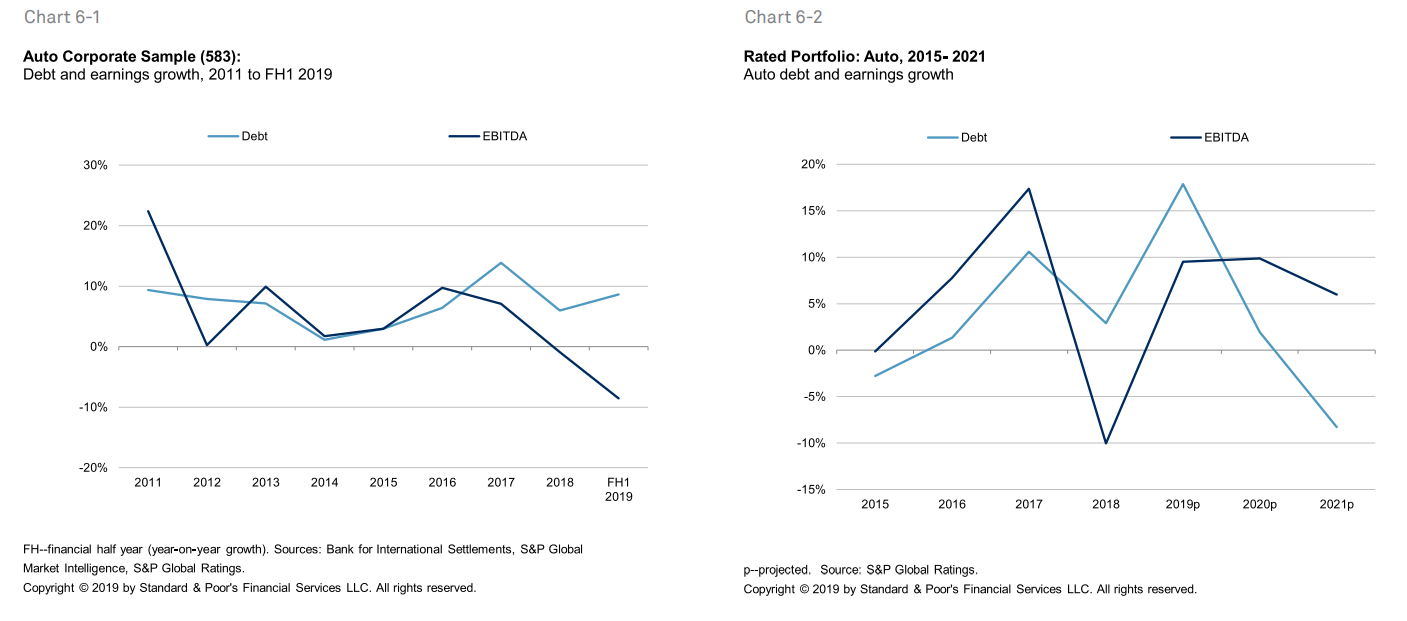
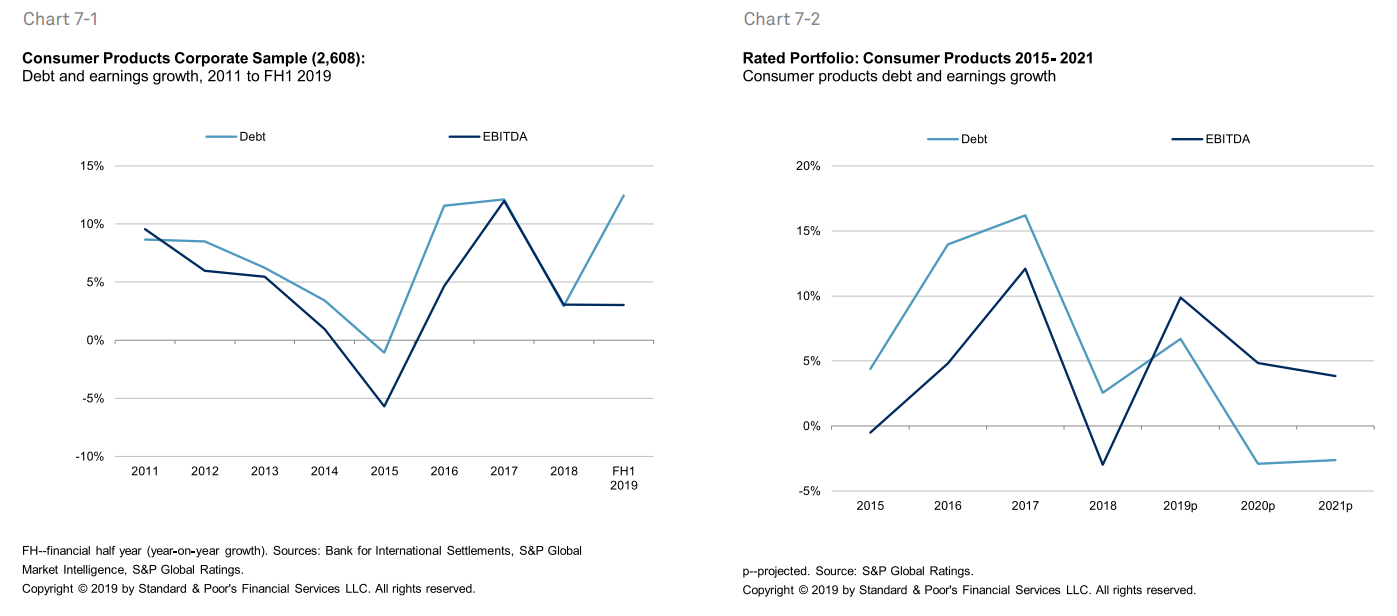
Automotive. The global car industry has lost its main growth engine. Contrary to initial expectations that the setback in the Chinese market would be temporary, sales volumes have now been declining for almost a full year. Prospects of a recovery in the second half of the year are dim. Consumer products. Liquidity and weak growth prospects underpin the negative outlook bias (i.e, more negative rating outlooks and CreditWatch listings than positive), particularly for speculative-grade issuers. Challenges include refinancing risk, constrained liquidity, and unsustainable capital structures.
Retail. In North America, specialty retailers continue to see declining customer traffic and promotional pricing pressure, resulting in unsustainable capital structures or narrowing liquidity. In Europe, the high street remains under pressure, with pockets of improvement. Apparel and department stores have faced negative pressure for the past two years.
Additional sectors. The top-five rated sectors where credit risk is highest (as measured by our net negative outlook bias) are, by region:
- Asia-Pacific: Automotive, consumer products, gaming, telecoms, and transport cyclical (see report on credit conditions in Asia-Pacific published Sept. 30, 2019).
- Europe: Automotive, steel, technology, real estate, and transport infrastructure (airports) (see Credit Conditions EMEA, Sept. 30, 2019).
- North America: Automotive, consumer products, healthcare, retail, and pharmaceuticals (see Credit Conditions North America, Sept. 30, 2019).
(Charts for additional industry sectors are provided in Appendix 3).
Broader universe. We see the unrated sample as reasonably representative of the wider universe of corporate borrowers. Chart 9 illustrates the macro picture: corporate debt rose faster for the first calendar quarter 2019, while 2019 nominal GDP growth is expected to fall. We presume a co-relationship between nominal GDP growth and earnings growth.
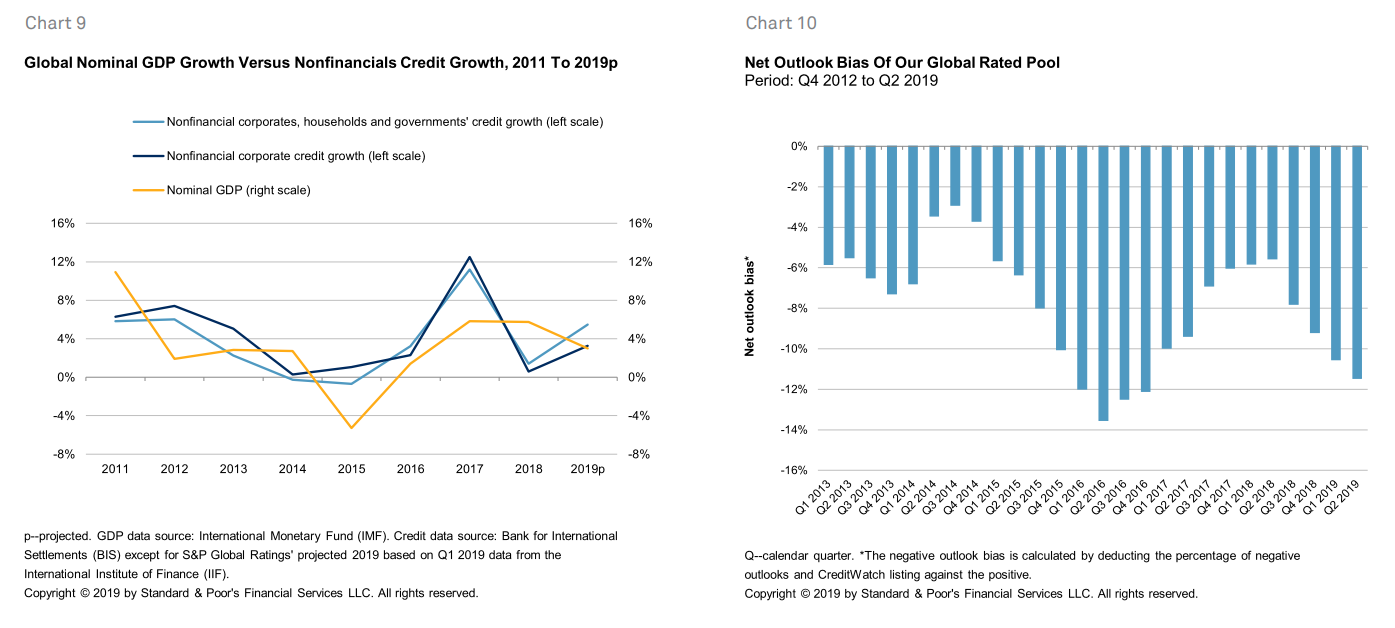
Rating trends. Chart 10 shows the net outlook bias for our global rated corporate portfolio. The worsening ratings outlook trend, which started in third quarter 2018, has been a forward indicator of corporate credit trends. One obvious manifestation of such a trend has been the recent decline in earnings growth.
Default correlation. Th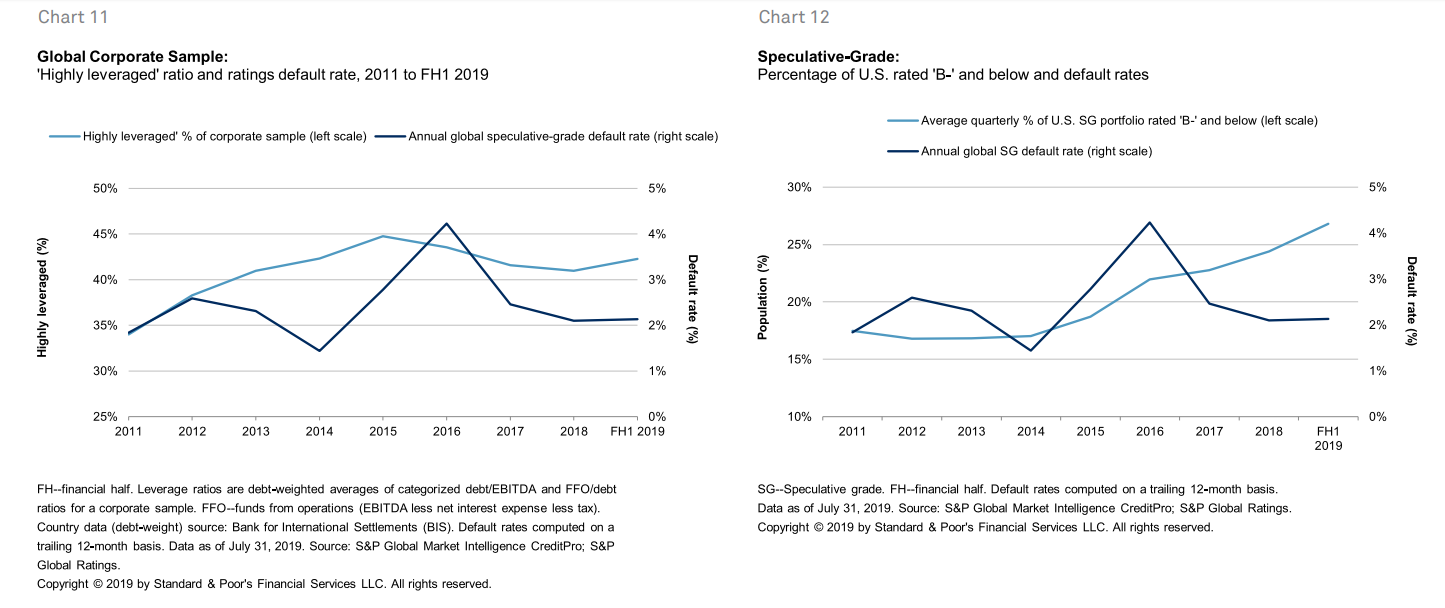 ere appears to be some correlation, albeit imperfect, between the "highly leveraged ratio" of the unrated sample and the annual speculative-grade default rates of our rated portfolio (see chart 11). In chart 12, we show the rising trend of U.S. corporate issuers rated 'B-' and below as a percentage of speculative-grade issue ratings. Past trends have indicated that a profusion of new 'B-' ratings is a leading indicator of default rate spikes (see "The Expansion Of The 'B-' Segment Is Feeding Growing Vulnerabilities," published Sept. 25, 2019). (Highly leveraged is the lowest classification of our six-tier leverage risk categories).
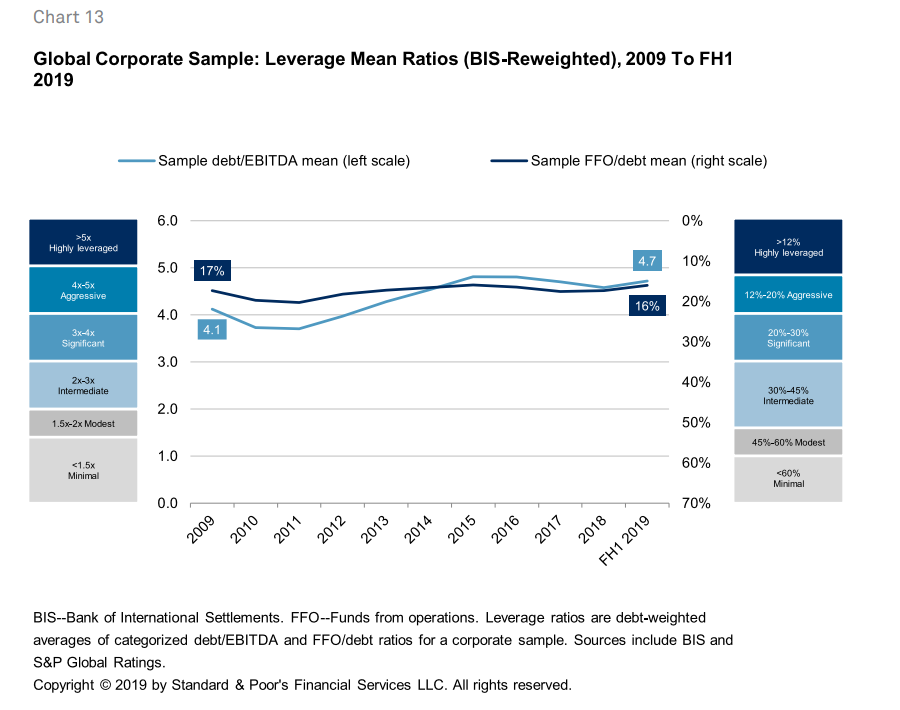
Low interest rates. The decade-long low interest rate environment has helped sustain the debt-servicing ability of corporate borrowers. Chart 13 shows the trend in the ratios of debt-to-EBITDA and funds from operations (FFO)-to-debt for the corporate sample. The FFO-to-debt ratio mean has been largely flat while the debt-to-EBITDA mean has worsened. This is explained by the FFO-to-debt ratio being computed on an after-interest expense basis and the debt-to-EBITDA ratio before. In short, the leverage fundamentals would look worse if not for the prevailing low interest rates.
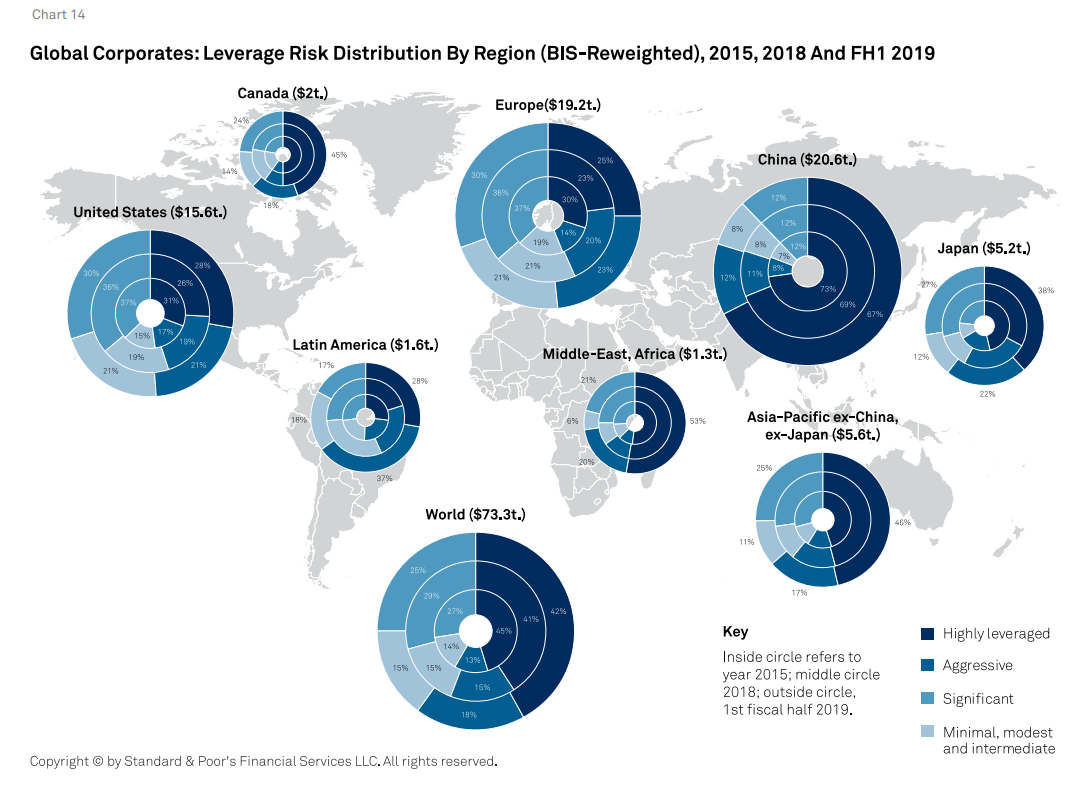
China riskiest. The leverage of the unrated sample slightly worsened in first-half 2019 compared with 2018 (see chart 14). Same result when compared with 2015, the most recent trough in global nominal GDP growth (see chart 10). Among geographies, China's corporates (note: some are government-related entities which benefit from potential state support) have the largest absolute debt and, within the unrated sample, the highest risk mix. While China's leverage did hold steady in first-half 2019, the continuing economic slowdown there is likely to apply some pressure. The risk distribution in Europe and the United States remains better than in most emerging markets.