Discover more about S&P Global’s offerings
Presence of asymptomatic infections suggests the numbers of Covid-infected patients in India is higher than reported.
Industrial and service sectors, accounting for ~85% of GDP, suffered the most because of the nationwide lockdown, as shown in the first quarter GDP data.
CRISIL cut through the clutter to analyse four important metrics related to the pandemic – the number of daily cases reported, the rate of recoveries, the state-wise patterns, and the rate of growth in new cases (India and state-wise).
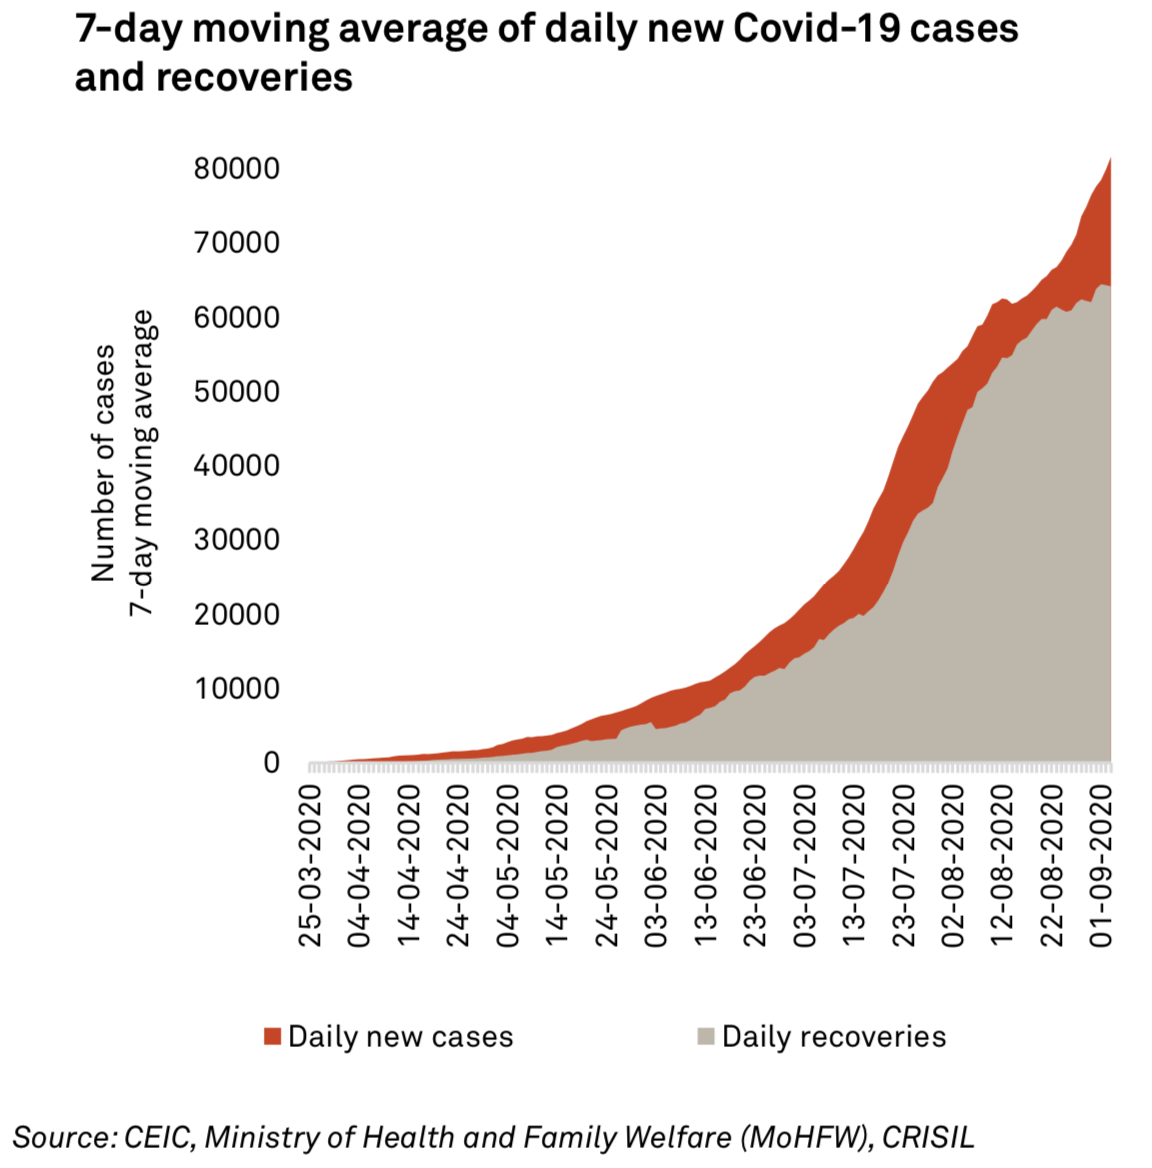
The number of confirmed Covid-19 cases in India crossed 42 lakh as on September 7. In the last week of August, India reported ~5 lakh new cases and the highest numbers of new cases globally. Early predictions by various agencies of the number of cases in India peaking in the early part of the July-September quarter have come to a naught. Even if recoveries have risen to 77.3% as on September 7, the daily rise in cases continues to surpass the daily number of recoveries. Globally, too, the virus is rearing its head again, with Japan, South Korea, Europe and Hong Kong, seeing new cases lately.
Within India, the caseload remains concentrated in states which have a major share in India’s GDP: Maharashtra, Tamil Nadu, Karnataka and Andhra Pradesh together account for ~54% of India’s total confirmed cases and ~36% of India’s GDP.
Then, there is the growth rate in the number of daily new cases to consider. To be sure, it slowed to an average daily growth rate of 1.7% in the last week of August compared with 2.1% in the last week of July. Among the states, the growth rate of cases in Andhra Pradesh (0.8%) and Tamil Nadu (0.3%) was way below the national average, while that in Assam (2.5%), Chhattisgarh (2.5%), Jharkhand (4.2%), which together account for 5.1% of GDP, was higher. Given the disparity in growth rates, a uniform peak in cases for the country as a whole cannot be expected, as per the Indian Institute of Public Health.
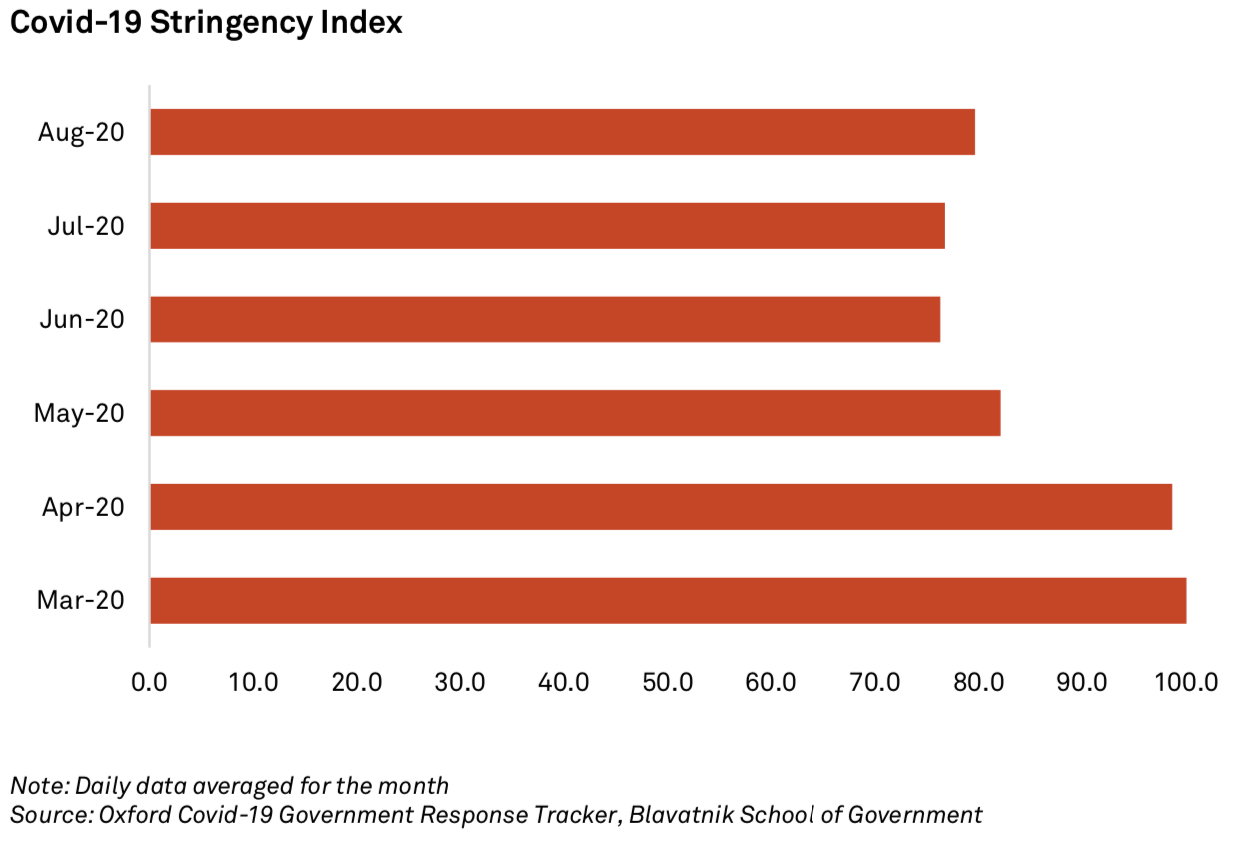
Despite the rising number of cases, another nationwide lockdown, and hence, another shock to economic activity as experienced in April-May, is unlikely. Oxford Stringency Index shows that the stringency of lockdown in India has reduced from 100 to about 80, where it stays. With ‘unlock’ already in its fourth phase, majority of the sectors have been allowed to operate.
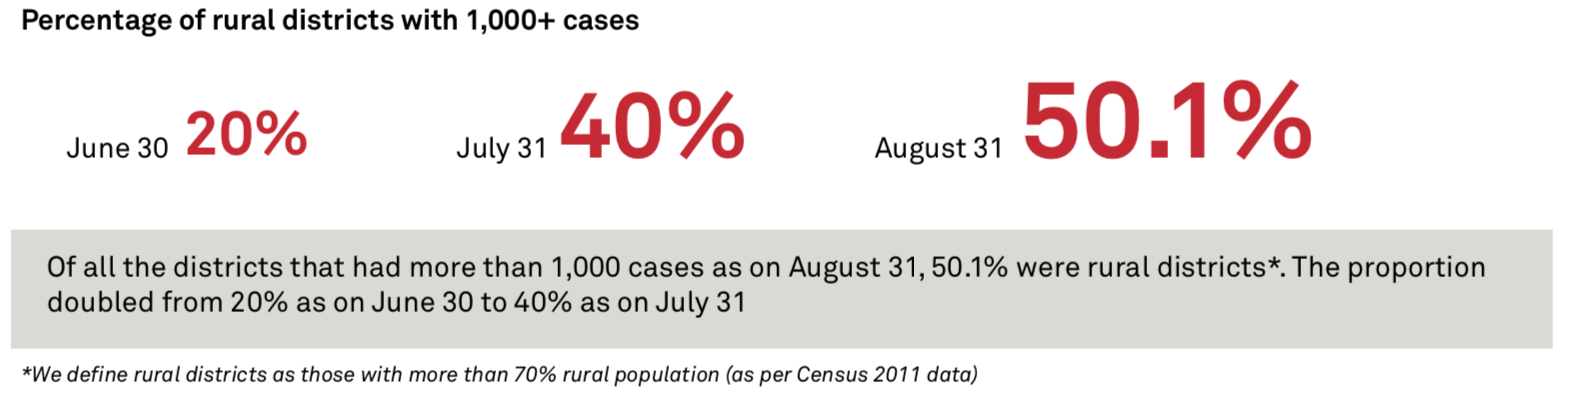
A district-wise trajectory of cases shows that at the start of unlock 1.0 (in June), cases were concentrated in Tier 1 metro cities such as Mumbai, Delhi and Bengaluru. But the pandemic has spread rapidly since then, as the figure below brings out.

The slowdown of cases in urban hotspots amid continued increase in daily cases indicates cases are dispersed within states, beyond metro cities. The reverse migration of workers in May likely fuelled transmission of the virus from urban areas to their hometowns/ villages. An increasing number of districts with predominantly rural population now account for over 1,000 cases, indicating the virus is spreading in rural areas
Presence of asymptomatic infections suggests the numbers of Covid-infected patients in India is higher than reported. Serosurveys help to understand the proportion of population exposed to coronavirus, including asymptomatic individuals. Serosurveys conducted by Indian Council of Medical Research in 60 districts in May estimated the exposure to the virus at 0.73%. Results of surveys by state governments later in July suggest wide spatial variation in the exposure to the virus, with higher infection rates in urban areas than rural: while Delhi showed sero-positivity of ~23%, and Mumbai of ~40%, surveyed districts in Chhattisgarh, Bihar, Jharkhand showed positivity rate of less than 1%. Depending upon the level of prevalence of infection, appropriate public health interventions can be planned to control further spread of the virus. This is particularly required when some areas are showing a resurgence in cases, reasons for which vary from increased testing to ‘Covid-19 behaviour fatigue’, as per the Director, All India Institute of Medical Sciences (AIIMS).
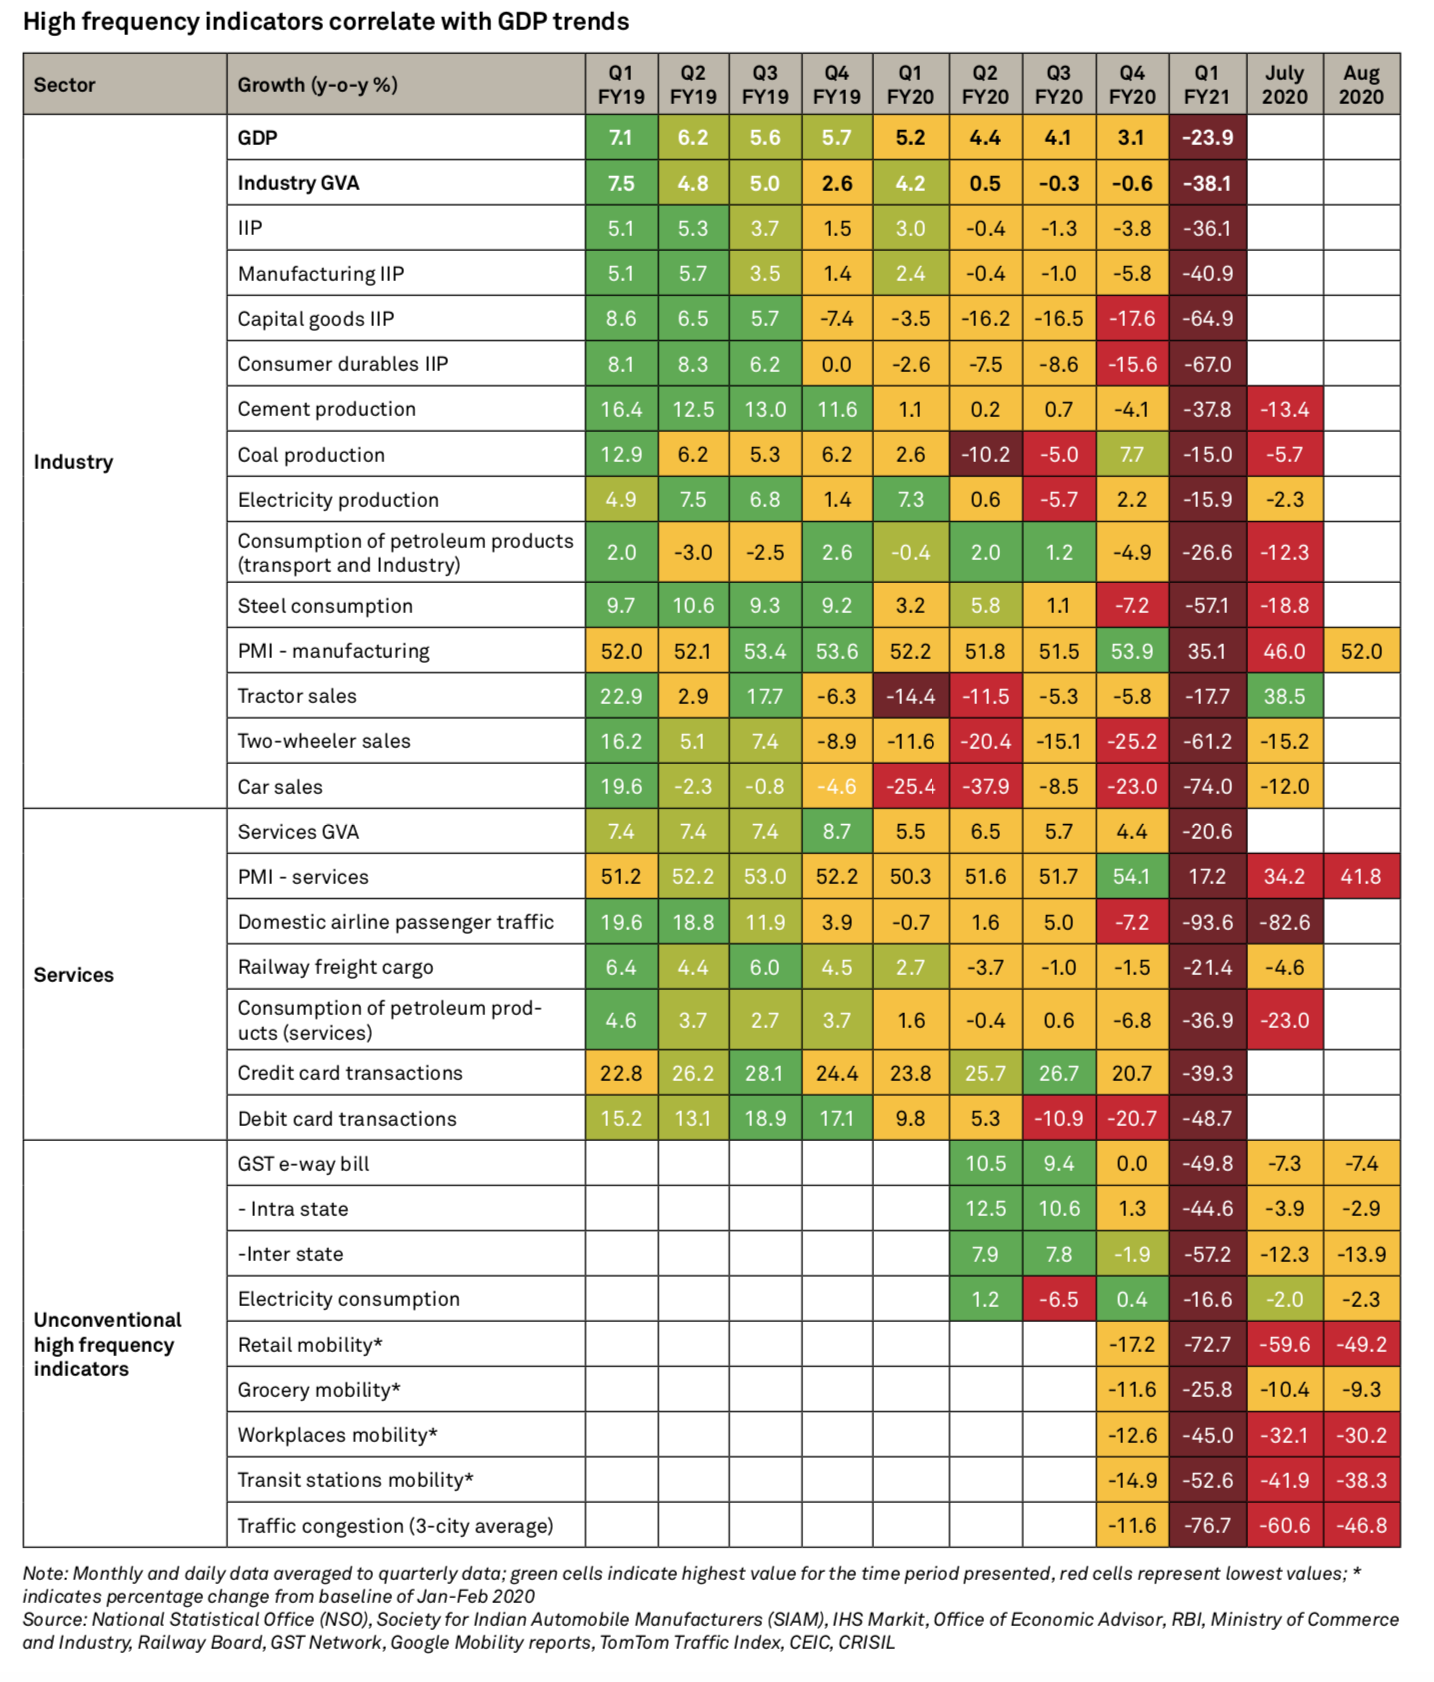
Industrial and service sectors, accounting for ~85% of GDP, suffered the most because of the nationwide lockdown, as shown in the first quarter GDP data. Both conventional and non-conventional high-frequency indicators pointed towards a deep downturn in these sectors (see table below):
Index of Industrial Production (IIP) and core infrastructure indices correlated with a sharp contraction in gross value added (GVA) from industry in the first quarter. Consumption of major inputs such as petroleum and steel were in the red. Auto sales and exports growth, which were declining even prior to the pandemic-shock, reached their troughs during the period
A steep slide in services sector was reflected in de-growth in airline passenger traffic, number of telecom subscribers and contraction in PMI- services
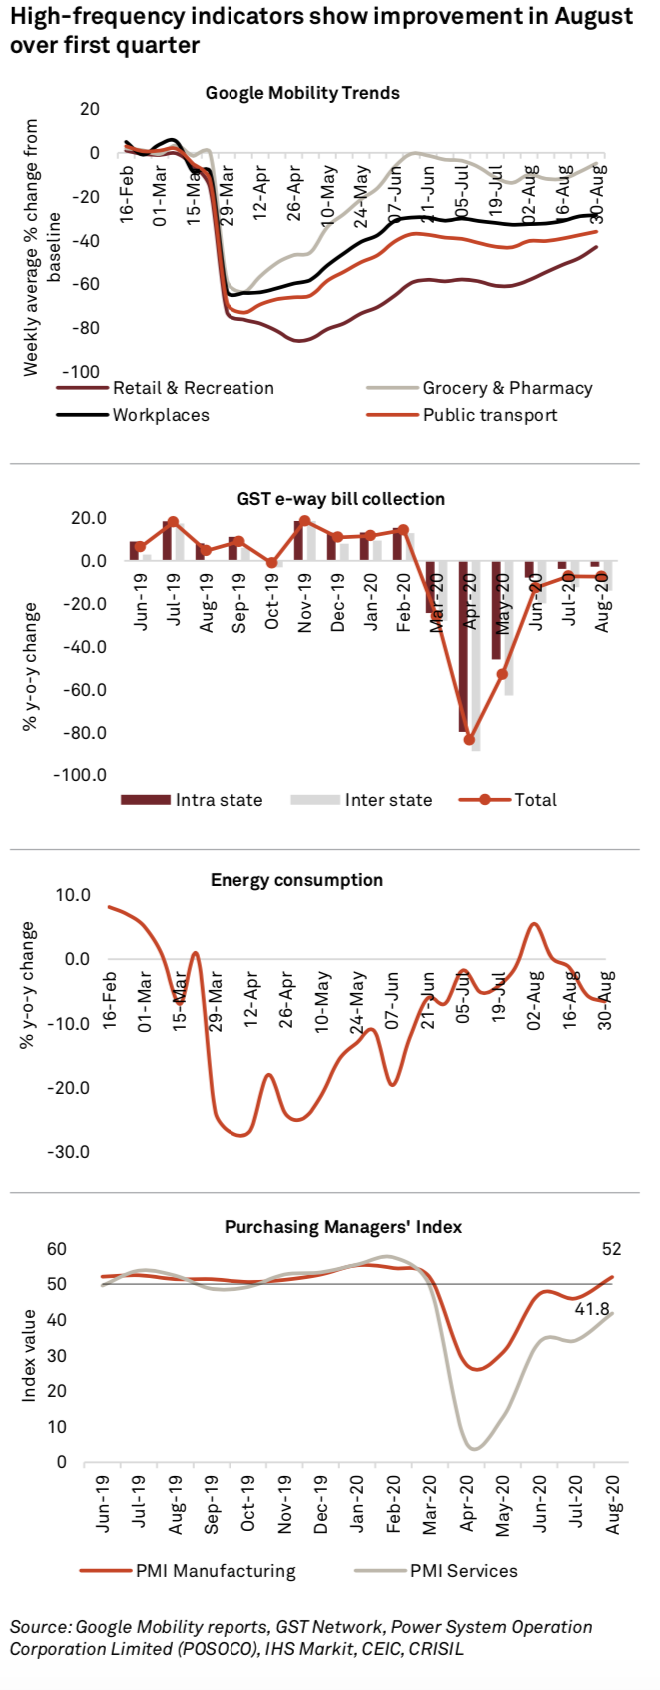
Other ultra-high frequency indicators showed a similar decline: mobility took a sharp hit post imposition of lockdown in March and April, and began recovering slowly from May, only to plateau in June-July as localised restrictions took effect. Electricity consumption was volatile, with deep troughs through April-June. Goods and Services Tax (GST) e-way bill collections declined drastically by ~50% on-year, hampered by restrictions on movement
• Data shows GVA from industry contracted at a faster pace (38.1%) than services (20.6%), partly due to the sharp contraction in construction (~-50%) included under industry (for details, see Annexure). Within services, those involving face to face contact suffered the most and will take longer to revive
− Trade, tourism, transport under services GDP was down 47% on-year
− Surprisingly, growth in even ‘public administration, defence and other services’. This is likely to be due to a sharp decline in ‘other services’ category, which includes education, recreation and cultural activities, beauty treatment, etc.
High-frequency economic indicators till August-end show recovery vis-à-vis the first quarter, however, they remain in de-growth phase, indicating economic contraction will continue in the second quarter, but not as severe. We expect GDP contraction in the second quarter at 12% on-year.
Even as real economic activity indicators reveal an uneven pace of economic recovery, inflation has been accelerating in India: Consumer Price index (CPI)-based inflation has been above the RBI’s target band of 2-6% for April-July, coincident with the lockdown and unlock periods. Supply-side disruptions in food (primarily, vegetables and meat & fish and egg products) are largely contributing to a rise in headline inflation. But the pandemic has brought forth a demand shock as well: arising from higher economic uncertainty, reduced incomes and consumption, owing to risk aversion.
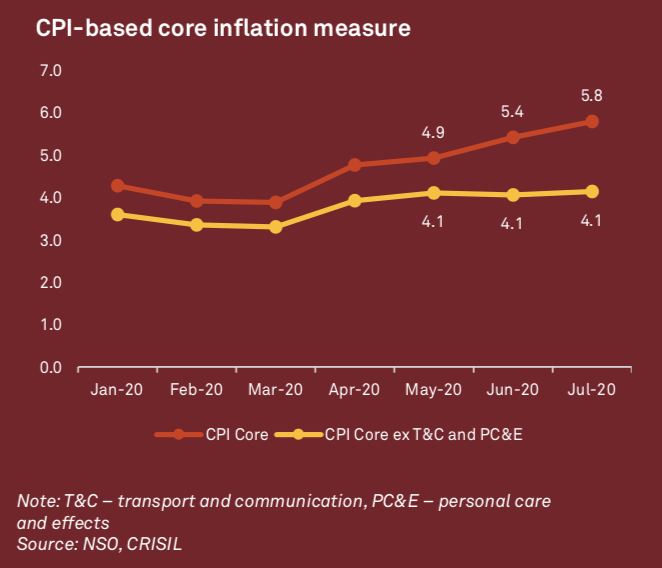
To assess whether prices are at all signalling recovery in demand or economic activity, we turn to core inflation (headline inflation, excluding food & beverages and fuel). Core inflation too, has been snaking up, from 4.8% in April to 5.8% in July, but that has not been due to demand pressures. Rise in core is largely led by transport and communication, and personal care and effects. Inflation in the former category was on account of higher petrol (11.2% in July on-year) and diesel prices (13.1%) and mobile charges (15.3%). Inflation in the latter was driven by a sharp increase in gold (45%) and silver (37.6%) prices, demand for which surged amid a rush for safe haven investments globally.
Stripping the core inflation of the price effects of these two categories, we find that this measure of inflation is almost flat since April, indicative of persistent weak demand. Our expectation is that with shrinking GDP, price pressures from idiosyncratic factors such as food and fuel are unlikely to morph into sustained generalised inflation.