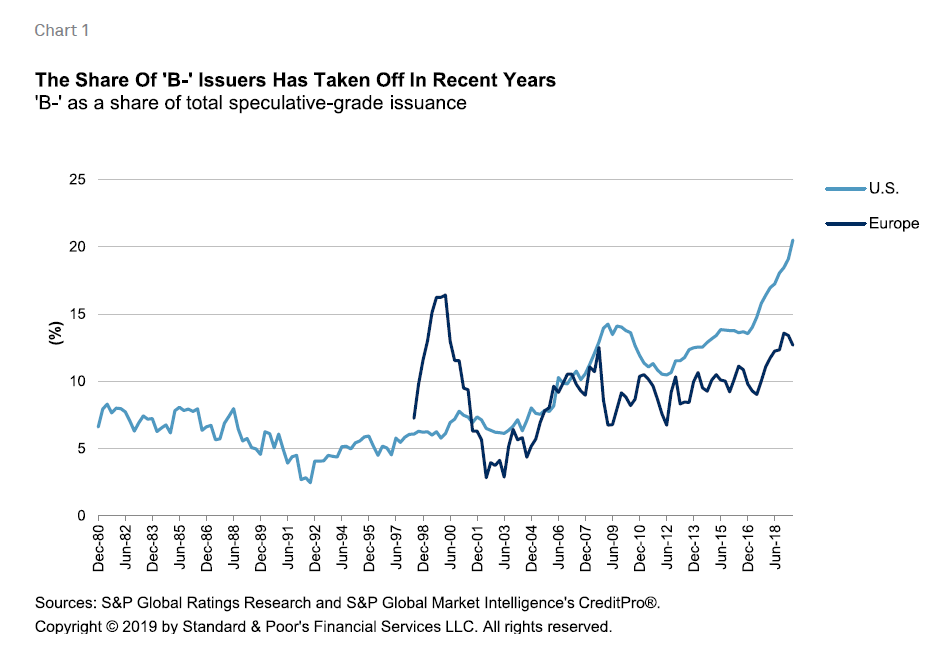
The 'B-' Segment Has Grown Significantly In Recent Years
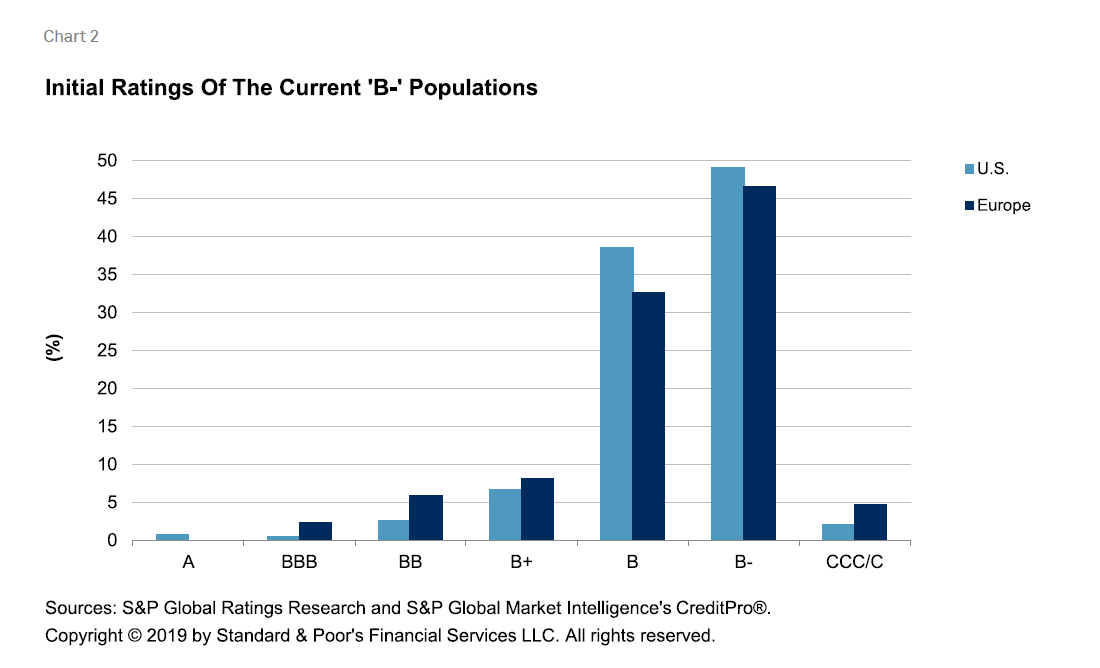
Sep. 25 2019 — Historically, the 'B-' rating segment in the U.S. and Europe owes much of its membership to prior downgrades. However, the current populations in these regions are largely derived from issuers with initial ratings of either 'B' or 'B-' (see Chart 2). Low interest rates across the globe after the financial crisis have allowed already leveraged companies to take on more debt relatively cheaply.
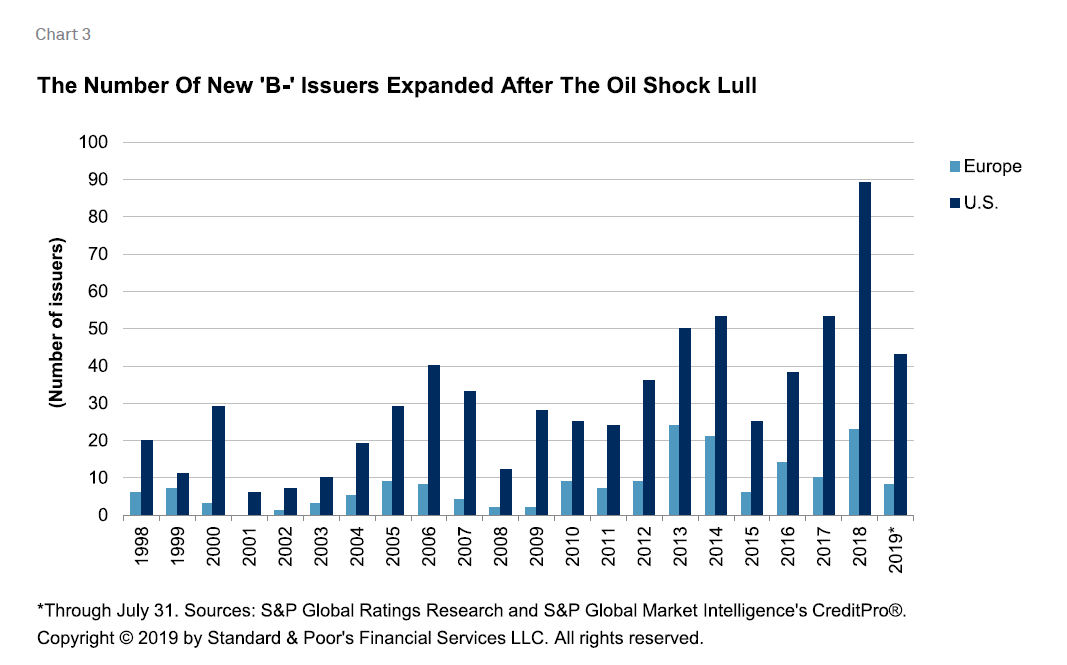
Growth of new issuers with an initial 'B-' rating has also been remarkable in recent years (see Chart 3). This was especially the case in the U.S. in 2018, when 81 issuers were assigned initial 'B-' ratings (along with another eight that reemerged from prior defaults). Nearly half of these first-time-rated issuers were from the high tech and health care sectors, with the largest subsectors being software and services providers in high tech as well as health care services companies (as opposed to pharmaceutical and equipment companies). And there is no sign of this stopping. The pace of new issuers with a 'B-' rating in 2019 is on track to reach 87 by year's end.
In both regions, the consumer products, health care, media and entertainment, and high tech sectors dominate the 'B-' population. The consumer products, retail/restaurants, and media and entertainment sectors have had median ratings within the 'B' category for an extended period, so they're not new entrants in this rating level, nor are they unfamiliar with periods of high default rates. Health care and high tech did have a prior cycle of boom and bust in the late 1990s through the peak default rate in 2000-2001, but they have had relatively few defaults after the dot-com bubble. That said, their recent growth of speculative-grade new issuers has been quick, with many starting out in the 'B' category.
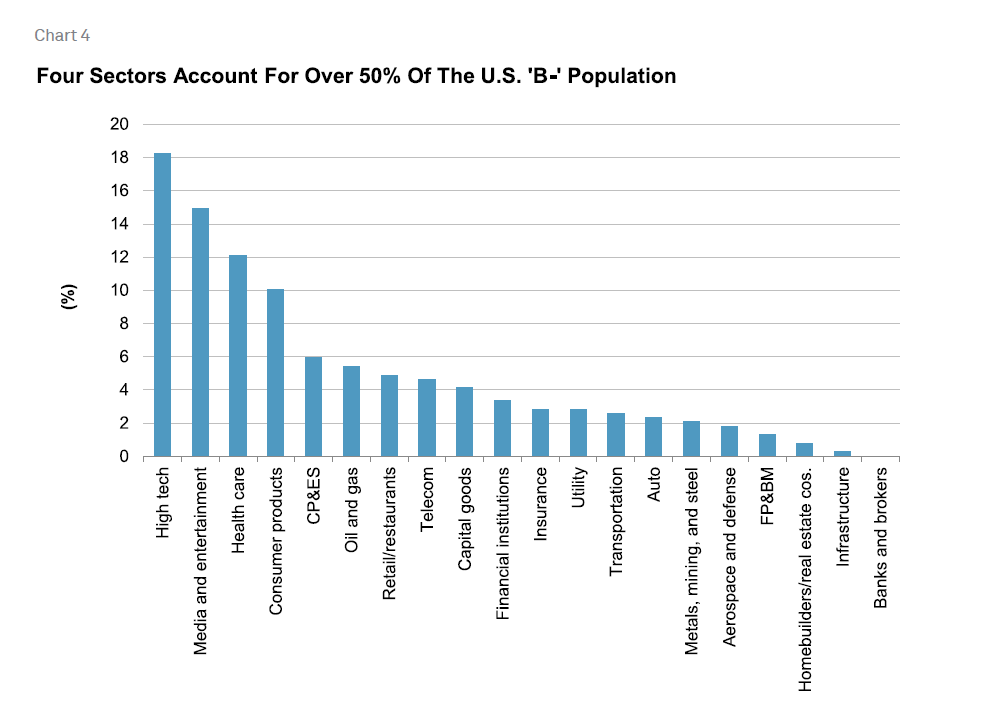
Within both the U.S. and Europe, the majority of the current 'B-' populations are in a handful of these industries. In the U.S., the high tech, media and entertainment, health care, and consumer products sectors together account for over 55% of all U.S.-based 'B-' issuers. Including the somewhat beleaguered retail/restaurants and oil and gas sectors, this figure jumps to nearly two-thirds of the total (see Chart 4).
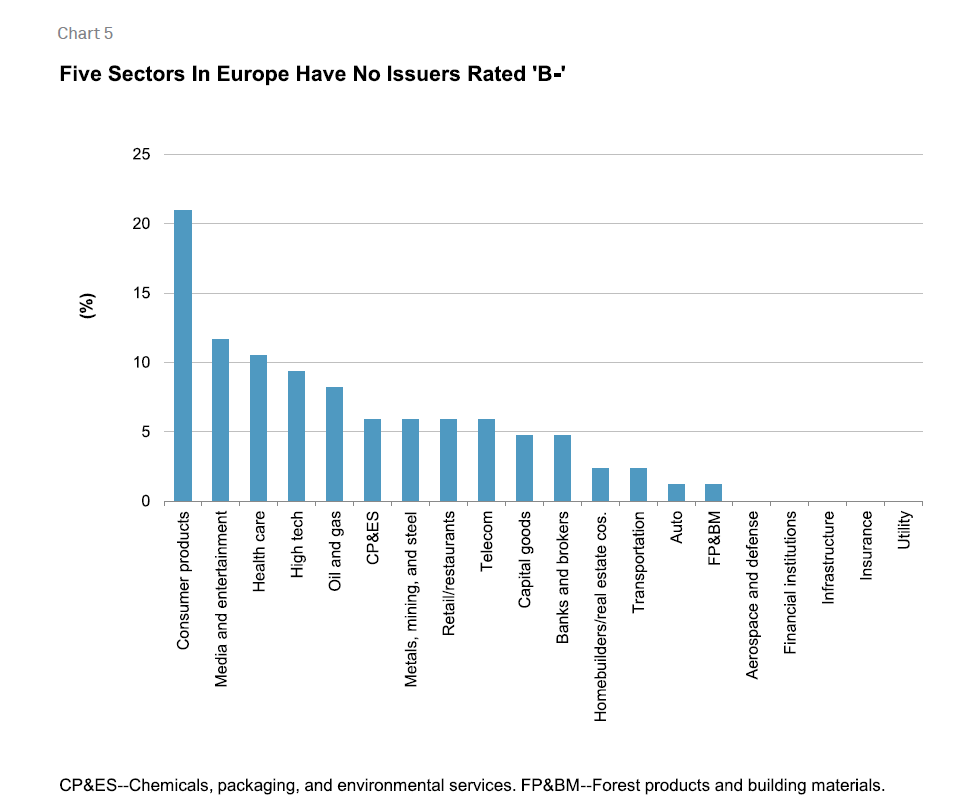
Meanwhile, in Europe, the consumer products sector alone accounts for 21% of the 'B-' population. That sector--when combined with high tech, health care, and media and entertainment--accounts for over 52% of the region's 'B-' issuers (see Chart 5).
Experience Portends A Harsh Future If Stress Grows
An analysis of S&P Global Ratings' long-term transition rates shows that as ratings decline, rating stability declines as well. Downgrade and default rates tend to increase with lower ratings, and the gap between subsequent ratings increases noticeably once into the 'B' rating category. This finding is also consistent with our credit stability criteria (see "Methodology: Credit Stability Criteria," May 3, 2010). Because there is a growing concern--particularly among CLO investors and managers--over not only increased default potential with a rising proportion of 'B-' issuers but over increased downgrades, we examined the overall track record of 'B-' credit deterioration (see Chart 6).
Within both the U.S. and Europe, the 'B-' segment displays consistently high rates of credit deterioration, in the form of downgrades and defaults. Even in more benign periods, this combined default and downgrade rate still stays at about a 10% minimum in the U.S. and Europe. In comparison to the overall speculative-grade segments in both regions, 'B-' issuers in the U.S. have had an overall credit deterioration rate that is, on average, 4.3% higher since 1998, while in Europe, this has averaged 3.1% higher since 2004.
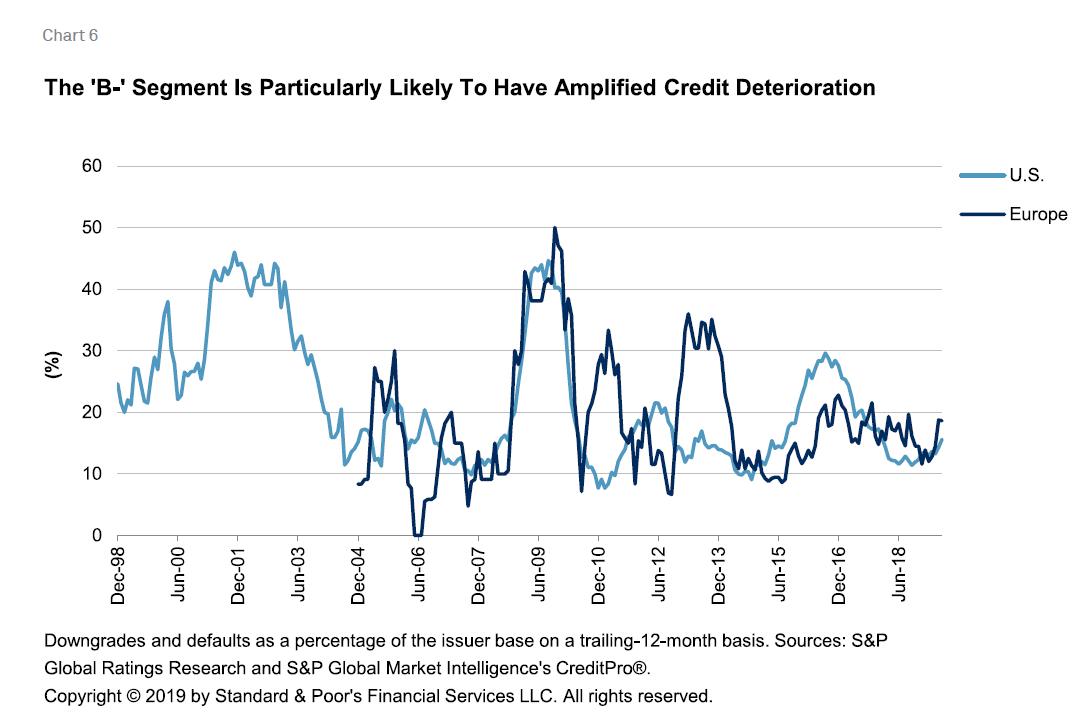
Whether around a major default cycle or during periodic increases (such as during 2016), increases in the downgrade rate tend to lead increased default activity. During the financial crisis, the downgrade rate among U.S. 'B-' issuers peaked at 26% in the 12 months ending April 2009, while the 'B- default rate hit its high point six months later in October (24%). In Europe, the comparable peak in downgrades came in February 2009 (33%), while the peak in defaults was also in October of that year (27%). With this general relationship in mind, the pace of 'B-' downgrades has been rising in both the U.S. and Europe recently--since October 2018 in the U.S. and since March 2019 in Europe.
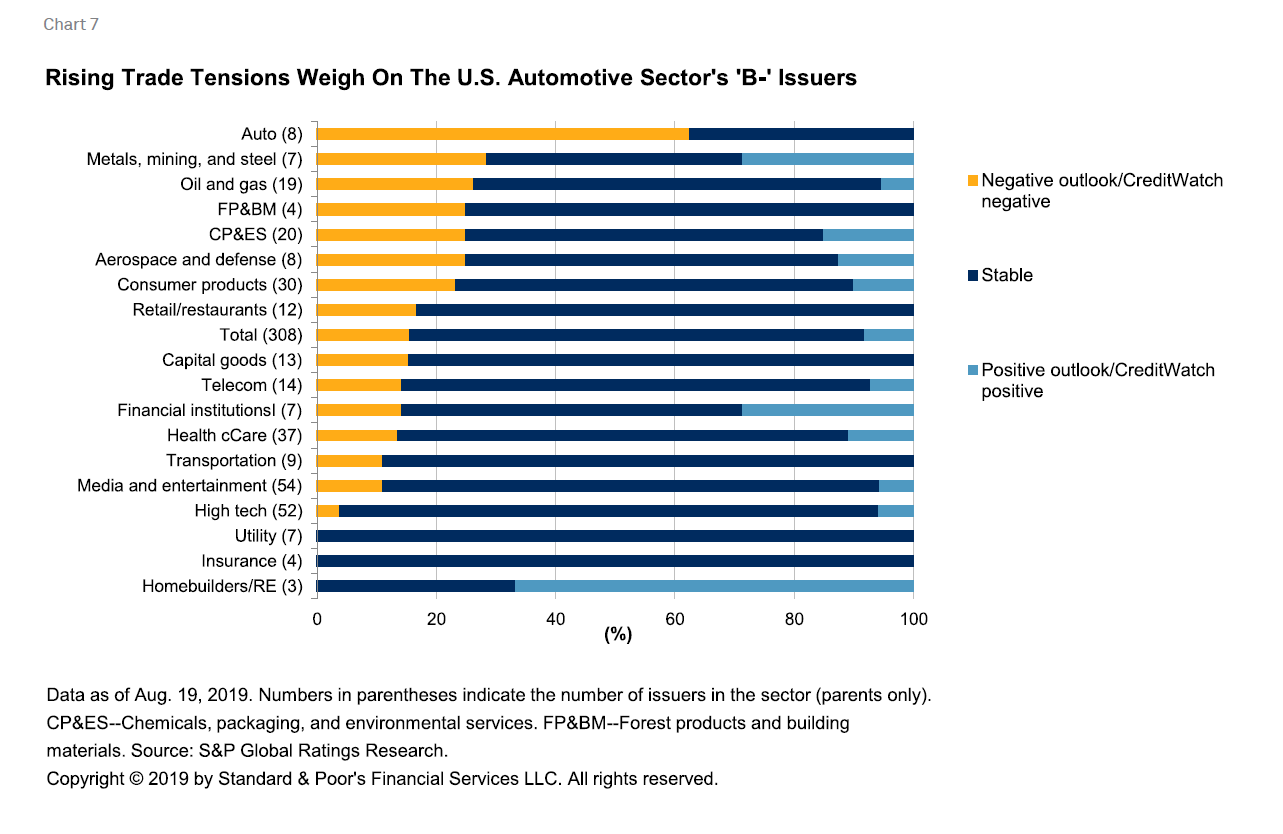
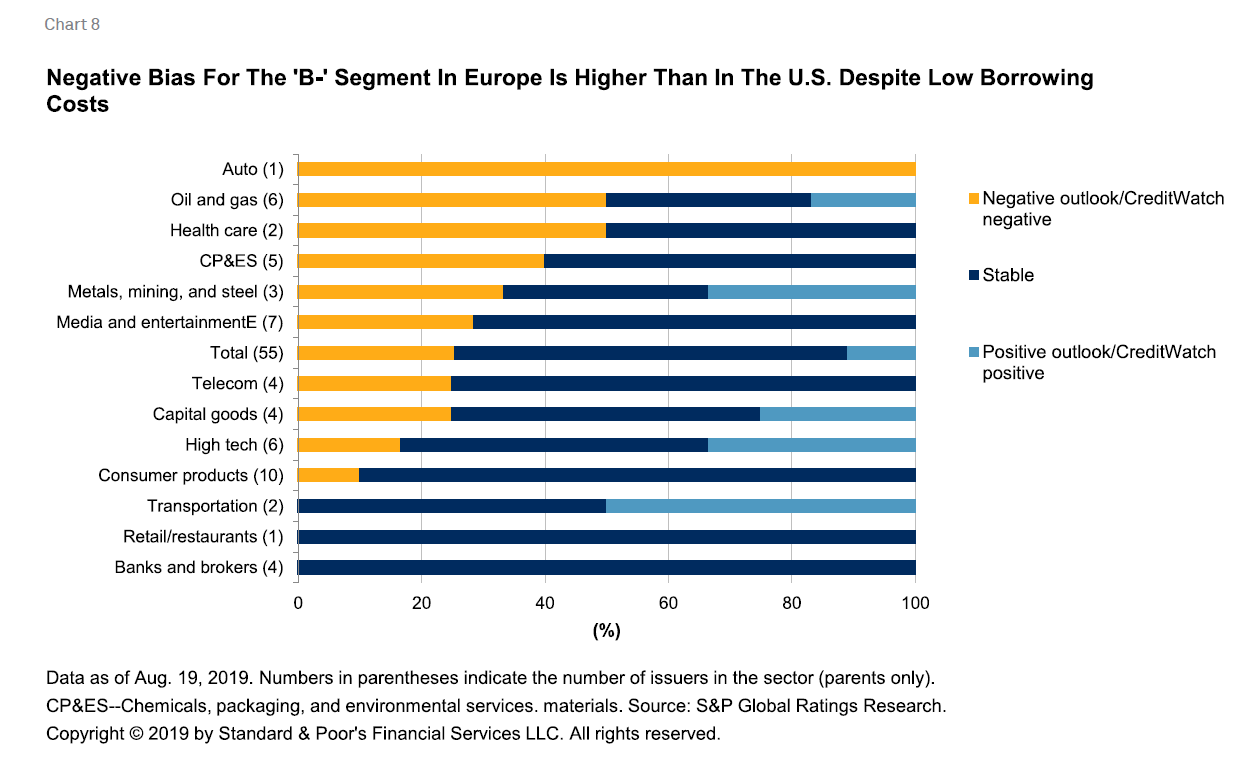
Currently, however, the credit outlook is relatively favorable, at least in the U.S. The current negative bias, which we define as the percentage of issuers with a negative outlook or ratings on CreditWatch negative, is 16% for the U.S. 'B-' population (see Chart 7). In Europe it is a bit higher at 25% (see Chart 8), as investors have been more selective in their search for yield recently, despite that many sovereign yields are now in negative territory. Rising trade tensions have started to weigh on certain sectors as well, such as automotive. For the most part, sectors with a negative bias higher than the overall 'B-' population appear to be smaller ones or those that also have a positive bias higher than the overall level. In both the U.S. and Europe, the oil and gas sector has a higher likelihood of increased downgrades, largely the result of persistently low oil prices, which are squeezing many smaller companies' operating margins. Given recent attacks on Saudi Arabian oil facilities, future oil prices could become higher or more volatile. However, as of Sept. 18, prices have generally been retreating for Brent and West Texas Intermediate after their recent highs on Sept. 16.
Consumer products and retailers in the U.S. are still dealing with a changing operating landscape, characterized by a shift to online shopping by consumers as well as increased price discovery, forcing lower profit margins. Although we currently forecast the U.S. default rate to reach 3.4% by June 30, 2020, in our base case, we expect the consumer products and retail/restaurants sectors to have a higher percentage of defaults than those of other sectors over the next 12 months, given their sector-specific stressors.
High Tech And Health Care Lead Among Lower-Rated Loans
Overall default risks may be historically low; however, the relative sensitivity of the 'B-' rating to credit deterioration over the long run is currently a cause of concern for many CLO managers and investors. The percentage of 'B-' leveraged loans in the S&P/LSTA U.S. leveraged loan index has passed 12%, and loans from companies rated 'B-' now constitute over 18% of assets in U.S. reinvesting broadly syndicated loan (BSL) CLO collateral pools, more than doubling the proportion of 'B-' assets at the end of 2015. Most BSL CLOs have an allowable bucket of 7.5% for loans with a 'CCC' rating in their collateral pool. Once the proportion of 'CCC' loans rises above this preset threshold, the par value of the loans will be haircut as part of the calculation of the par coverage test ratios. In such cases, the coverage tests could fail, resulting in payments to the equity trancheholders and subordinate noteholders being halted.
Currently, the 'CCC' bucket of our in-house index of 328 CLOs rated by S&P Global Ratings remains generally low at 4.52%, but this is also a high point for 2019. The recent increase is a result of a number of downgrades among 'B' rated issuers in August. In addition, average prices of loans from the 'CCC' category have declined to 79--the first time this average has dipped below 80 this year (see "U.S. CLO Index Sees Uptick In ‘CCC’ Bucket, Drop In Loan Price In August," Sept. 12, 2019).
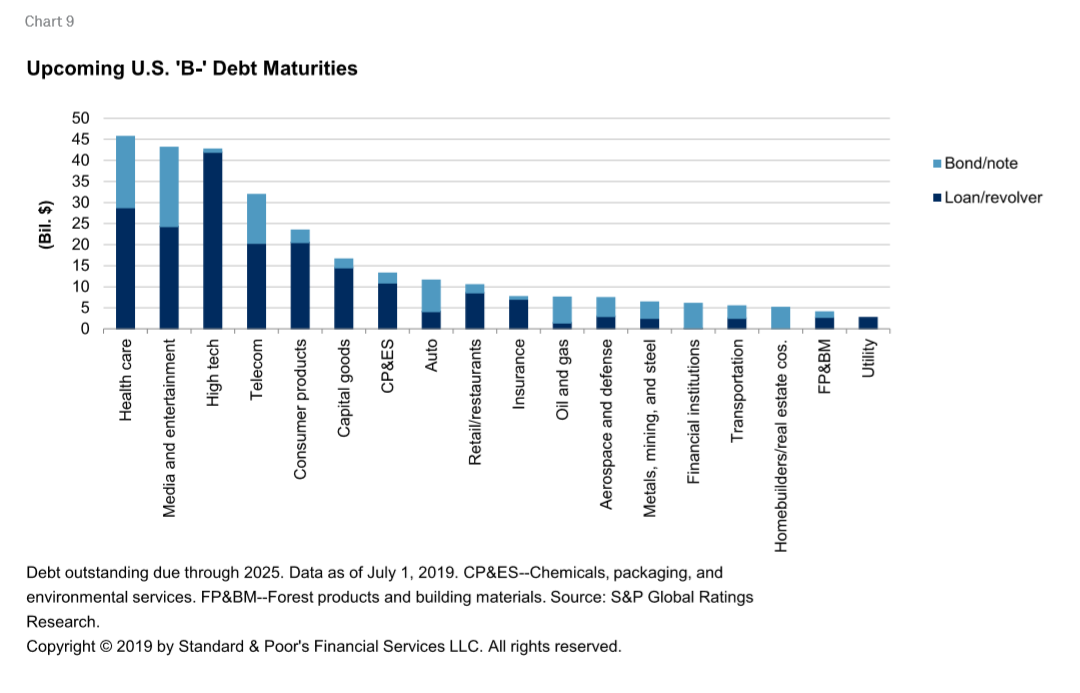
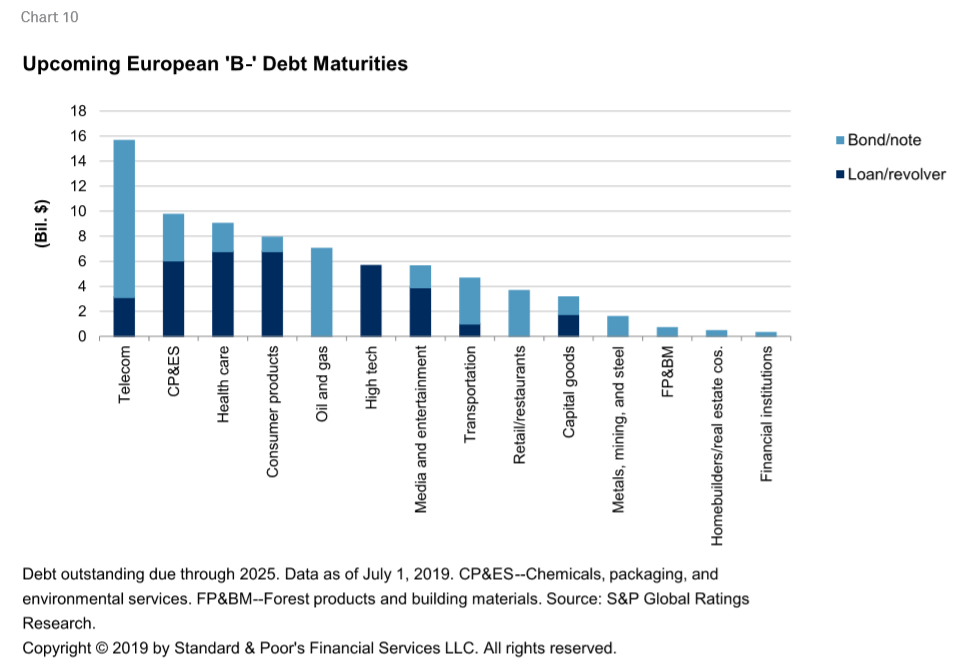
There are very different funding structures across sectors (see Charts 9 and 10). Although the oil and gas sector is considered one of the more vulnerable in the near term in light of still-weak (but unpredictable) oil prices relative to a year ago, the majority of its debt is in bonds. Meanwhile, high tech and consumer products rely much more heavily on loans. The high tech industry could be subject to heightened stress in case of continued deterioration in the U.S./China trade dispute, particularly if the U.S. follows through on its recently threatened next round of tariffs, which would hit both the consumer products and high tech sectors.
Many of the U.S. sectors most reliant on loans for their recent debt funding among the 'B-' population are also those most held by U.S. broadly syndicated loan (BSL) CLOs (on a dollar-weighted basis), per quarterly trustee reports (see Chart 11). As mentioned, the top four sectors in the U.S. account for 55 % of the U.S. 'B-' population, alone. Among the largest 250 BSL CLO holdings in the U.S. that are rated 'B-', these sectors account for nearly 76% of the total. High technology and media and entertainment together combine for 56% of these top 250 holdings within the 'B-' population. This disproportionately exposes CLOs to the risks associated with high tech and media and entertainment.

Given the sharp rise in 'B-' issuers in high tech in recent years as well as the structural headwinds facing consumer products and retailers, this debt can be a source of investor concern in the event of financial market volatility or an economic downturn. Currently, our economists are still expecting GDP to increase in the U.S. and Europe this year and next; however,those forecasts have been revised downward in recent quarters. Our U.S.economists have also recently raised their odds of a U.S. recession to 30%-35% over the next 12 months (see "U.S. Business Cycle Barometer: Recession Risk Rises, "Aug.15,2019), though closer to the top of the range given their augmented term-structure model signals a 35% risk of recession over the same period.
Lending conditions have recently received a positive boost from both the Federal Reserve and the European Central Bank from their recent cuts to interest rates and continuing asset purchases and--inEurope, at least--negative-yielding loans to financial institutions. This back drop should help markets reduce any sudden bouts of volatility or illiquidity in the near term. However, history has shown that even in calm times, the 'B-'segment has much higher ratings volatility and a higher likelihood of both downgrades and default.